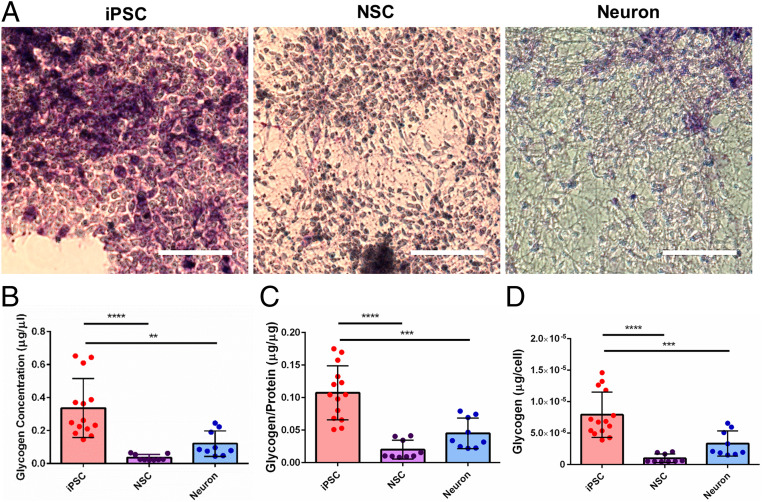
Fig. 4.
Confirmation of glycogen as a potential biomarker for cell quality control and lineage specification. (A) PAS staining of hiPSCs, hiPSC-derived NSCs, and hiPSC-derived neurons is shown in magenta color and counterstained with hematoxylin in deep blue-purple color. (Scale bars, 100 μm.) (B−D) Quantitative comparisons of the glycogen concentration in different cell lineages using a commercially available glycogen detection assay. One-way ANOVA with post hoc Tukey’s test was used. All experiments were performed with three biological replicates comprising at least three technical replicates (iPSC: n = 14; NSC: n = 9; neuron: n = 9). The results represent means ± SEM; ** represents P ≤ 0.01, *** represents P ≤ 0.001, **** represents P ≤ 0.0001, and there was no statistical significance between the other groups.

