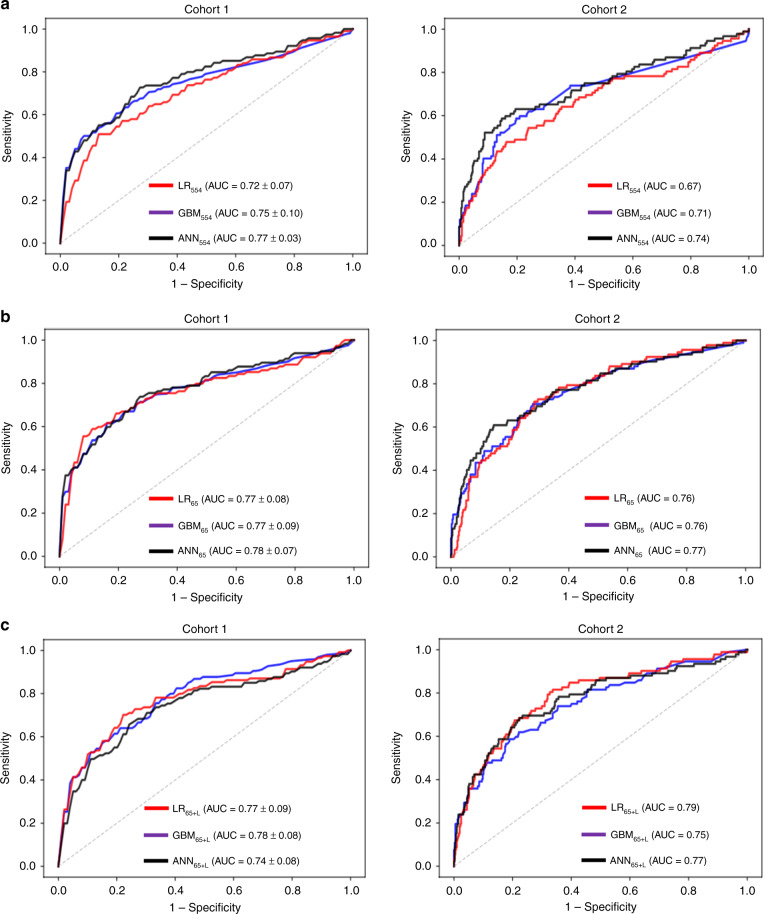
Fig. 2. Classification performance using machine learning classifiers.
This figure shows the ROC curves of logistic regression (LR), gradient boosting machine (GBM), and artificial neural network (ANN) classifiers using a all available ECG features (k = 554), b selected ECG features (k = 65), and c selected and relabeled ECG features (k = 65 + L). Cohort 1 was used for training with tenfold cross-validation, the figure shows mean ROC curve with ±2 standard errors. Cohort 2 was used for independent testing using the algorithm trained on Cohort 1.

