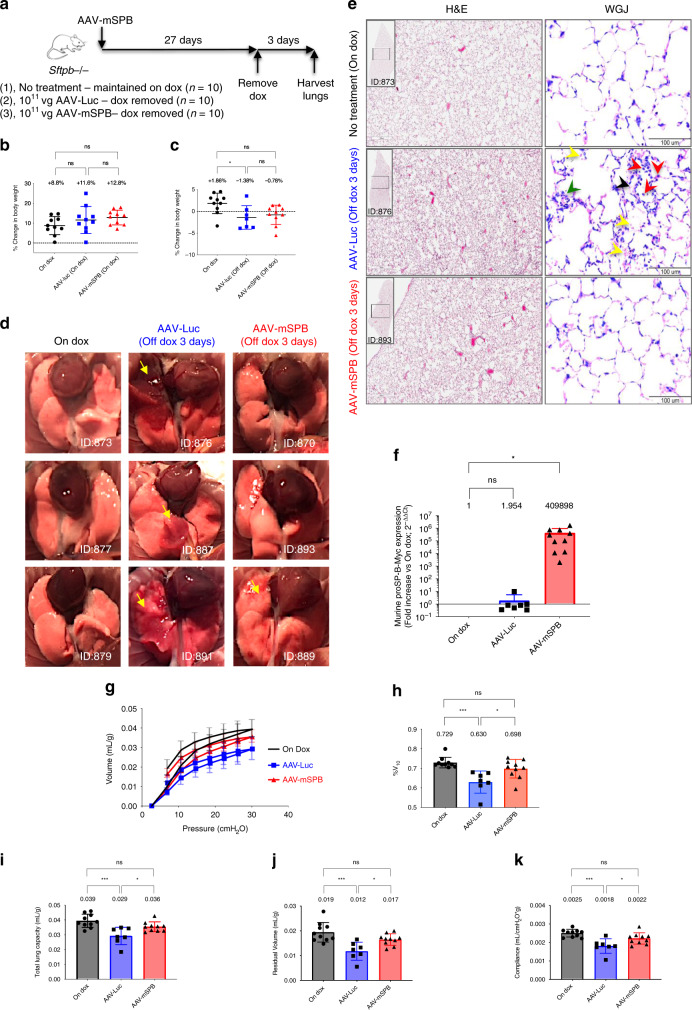
Fig. 4. AAV-mSPB prevents the lung phenotype of SP-B deficient mice.
a Study design to determine whether 1011 vg per mouse of AAV-mSPB improves lung structure and function in SP-B deficient mice. b Percentage change in body weight following AAV administration while still on doxycycline (dox) (27-day duration). c Percentage change in body weight after dox removal (3-day duration). All body weight data in c and d are presented as the mean with SD (n = 10, except AAV-Luc post-dox where n = 7; *P = 0.0294). d Representative gross lung images 3 days following dox removal. Yellow arrows indicate regions of lung injury. Mouse IDs are provided to match with histological or epifluorescence lung images when available. e Representative Hemotoxylin and Eosin (H&E) and Wright-Giemsa Jenner (WGJ) staining of paraffin embedded whole left lungs 3 days after dox removal. In the WGJ staining of the AAV-Luc lung, the red arrows indicate the ring-shaped and/or pretzeloid-shaped nuclei of neutrophils, the black arrow indicates hyaline membrane deposition, the green arrow indicates alveolar septal wall thickening, and the yellow arrows indicate red blood cells (H&E scale bar, 500 μm; WGJ scale bar, 100 μm). f The expression levels of murine proSP-B-Myc from right lung tissues 3 days after dox removal. All comparative qPCR data are presented as the mean with SD, and the On Dox group acts as a reference point with a value of 1 (n = 10, except AAV-Luc where n = 7; *P = 0.0185). g Pressure-volume curve 3 days following dox removal corrected for body weight (in mL per g) for mice on dox (black circles), mice treated with AAV-Luc off dox (blue squares), and mice treated with AAV-mSPB off dox (red triangles). The source data for g has been provided as a Source Data file. h %V10 corrected for body weight (*P = 0.0113, ***P = 0.0003). i Total Lung Capacity (TLC) corrected for body weight (in mL per g; *P = 0.0243, ***P = 0.0003). j Residual Volume (RV) corrected for body weight (in mL per g; *P = 0.0239, ***P = 0.0003). k Compliance corrected for body weight (in mL per cmH2O per g; *P = 0.0282, ***P = 0.0002). All lung function data are presented as the mean with SD (n = 10 except AAV-Luc post-dox where n = 7). (All P values in Fig. 4 = 2-tailed ordinary one-way ANOVA with Tukey’s or Dunnett’s (f only) multiple comparisons post hoc test, ns = not significant).

