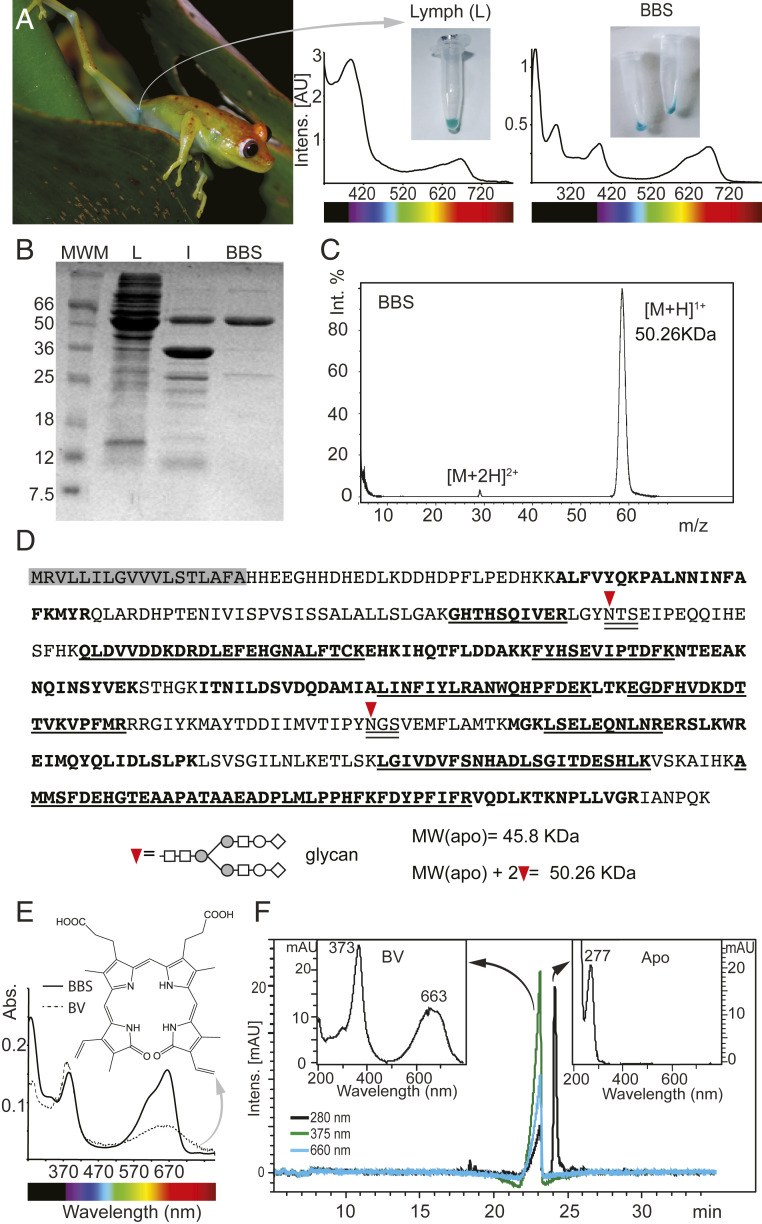
Fig. 2.
Purification of BBS from B. punctata green lymph. S.c. green lymph is clearly observable through the skin (A) and shows strong absorbance bands in the 400 nm and 660 nm regions. After removal of hyloins (2) and other yellow pigments, purified BBS is cyan with Soret band maximum absorbance at 390 nm and Q band at 667 nm. (B) PAGE of Lymph (L), lymph 80% ammonium sulfate precipitate (I) and purified BBS (B). MWM: Molecular weight marker (C) MALDI-TOF of purified BBS. Molecular weight is ∼50 kDa, which is consistent with (B). (D) Sequence of BBS. Shaded in gray is the predicted signal peptide. Bold fonts: Peptides obtained by MALDI-TOF that map to the sequence. Underlined fonts: Sequences that were verified by MSMS. Double underlined fonts: N-glycosylation consensus sequences. Inverted red triangle: N-glycosylation site. The predicted MW of the apoprotein obtained from the sequence is smaller than the empirical value obtained by MALDI-TOF (Fig. 2C). Two glycans at N-109 and N-269 account for the difference (see also SI Appendix, Fig. S5 and Table S3). Further analyses using Orbitrap showed 100% coverage of the sequence (SI Appendix, Table S3). (E) Organic solvent extraction of biliverdin (BV) from BBS. Ratio Soret/Q changes from 3.2 for the isolated BV to 1.05 in BBS. (F) HPLC of BBS. BV is separated from the apoprotein, which has no absorbance at visible wavelengths.

