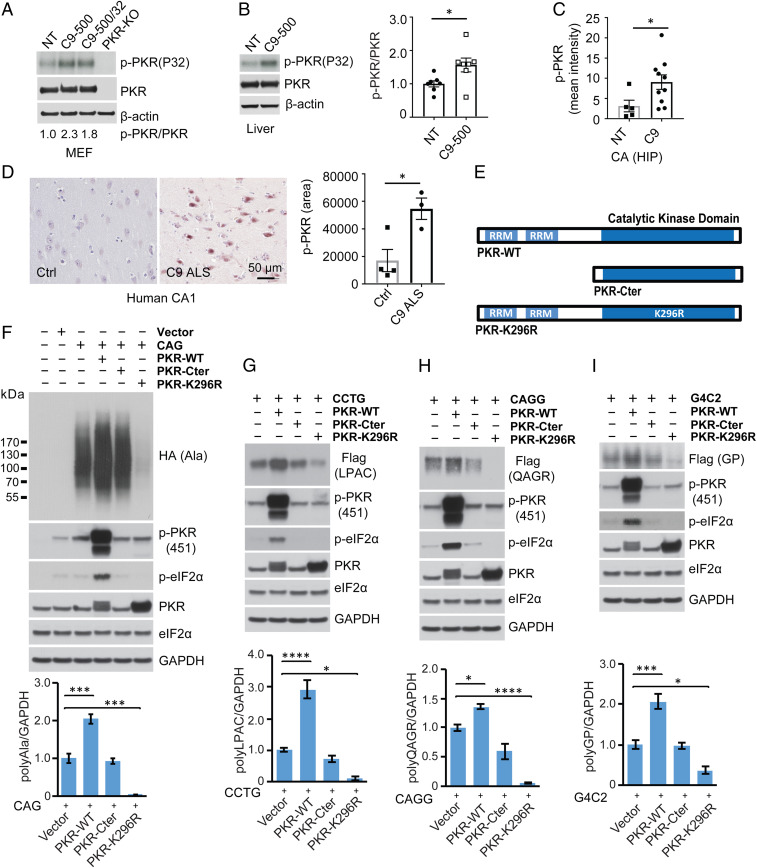
Fig. 1.
RAN translation of CAG, CCTG, CAGG, G4C2 expansions is regulated by PKR. (A and B) In vitro PKR kinase assay showing levels of p-PKR in MEFs (A) and liver (B) from C9 BAC and NT mice. (C) Quantification of p-PKR immunofluorescence staining in CA hippocampal region elevated in a cohort of phenotypic C9-500 vs. NT mice. (D) IHC showing α-p-PKR staining in CA1 of hippocampus is elevated in C9 human autopsy brains. (E) Schematic diagrams showing PKR-WT, PKR-C-terminal, and PKR-K296R constructs. (F–I) Immunoblots of HEK293T lysates after transfection with CAG (F), CCTG (G), CAGG (H), and G4C2 (I) expansion constructs with or without constructs expressing PKR-WT, PKR-CT, or PKR-K296R. Protein blots were probed for tagged RAN proteins, p-PKR, p-eIF2α, and total PKR. PKR overexpression increases phospho-PKR (p-PKR) and phospho-eIF2α (p-eIF2α), whereas PKR-Cter has no effect and PKR-K296R decreases steady-state levels of p-PKR and p-eIF2α. RAN protein quantification is shown in the lower graphs. Statistical analyses were performed using the t test (B–D) or one-way ANOVA with Dunnett analyses for multiple comparisons (F–I); *P < 0.05, ***P < 0.001, ****P < 0.0001; n ≥ 3 per group. Bars show mean ± SEM.

