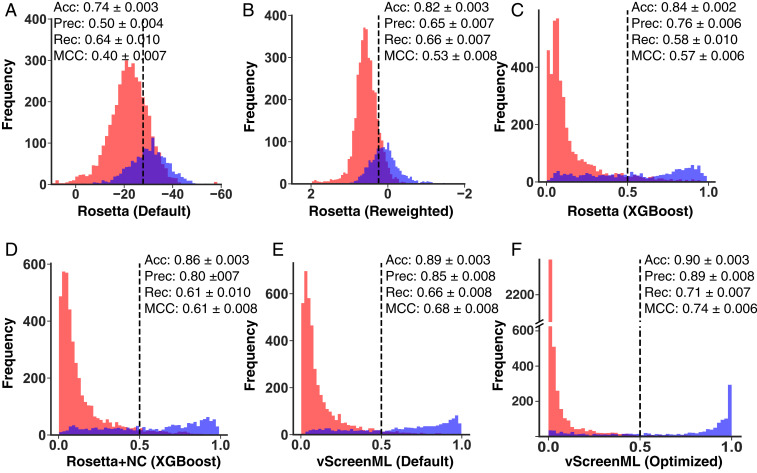
Fig. 2.
Development of vScreenML. Overlaid histograms are presented for scores obtained when scoring active complexes (blue) and decoy complexes (red) from D-COID. Scoring functions used were: (A) default Rosetta energy function, (B) linearly reweighted Rosetta energy terms, (C) Rosetta energy terms combined via XGBoost, (D) Rosetta energy terms plus structural assessments, (E) Rosetta terms plus additional diverse descriptors (nonoptimized vScreenML), and (F) vScreenML after hyperparameter tuning. Over the course of this sequence, the overlap between the active and decoy complexes is progressively reduced and MCC systematically increases. For the first two panels, 10-fold cross-validation was used to obtain the classification cutoff that maximizes Matthews correlation coefficient (MCC) on each subset of the data, and these cutoffs were used in calculating precision/recall/MCC. Because the remaining panels each report results from classification models, their thresholds are fixed at 0.5. Performance measures are presented as the average of 100 trained models, each of which derived from 10-fold cross-validation (Methods). Uncertainty is presented as 95% confidence intervals. In all cases, performance measures were calculated for a subset of the data that was held out from the training step.

