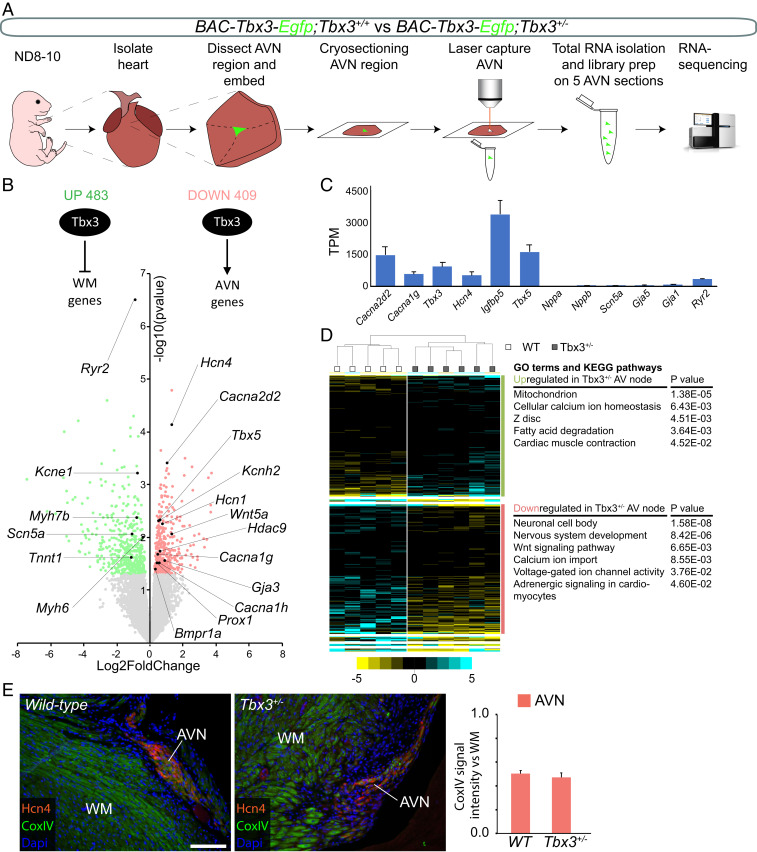
Fig. 2.
Tbx3 maintains pacemaker and conduction properties in the AV node. (A) Approach to obtain and define transcriptomes of WT and Tbx3+/− AV nodes. (B) Volcano plot of normalized expression levels in WT AV nodes over Tbx3+/− AV nodes. All significantly up-regulated genes are labeled green, and all significantly down-regulated genes are labeled red. P < 0.05 (red and green), P < 0.1 (light red and light green). (C) Average WT expression levels (in TPM) of conduction system and chamber genes. (D) Unsupervised hierarchical clustering of genes differentially expressed between Tbx3+/− AV nodes and WT AV nodes. GO terms and KEGG pathways associated with up-regulated (green) and down-regulated (red) genes in Tbx3+/− AV nodes. (E) Representative immunostaining for Hcn4 (red), CoxIV (green), and nuclei (blue). Graph shows quantification of CoxIV signal intensity in AVN normalized to WM in WT and Tbx3+/− sections (n = 3). AVN, AV node; WM, working myocardium. (Scale bar: 10 µm.)

