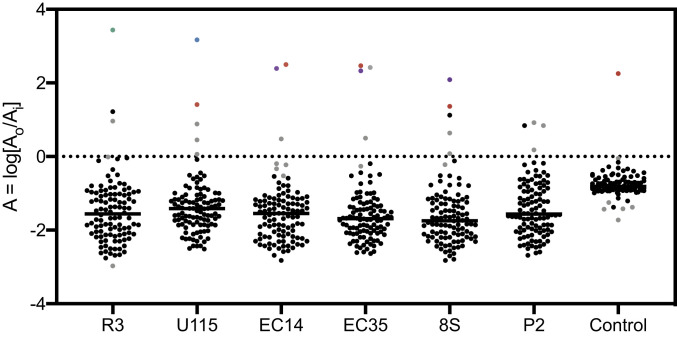
Fig. 5.
Log ratio of the relative abundance of 106 transposon mutants in genes encoding membrane proteins for each screen with uncharacterized phages. Gray represents statistically significant hits, and other top hits ompA::Tn, tsx::Tn, ompC::Tn, and lamB::Tn are in green, blue, purple, and red, respectively. The outlier in the control screen is lamB::Tn (P < 0.05).

