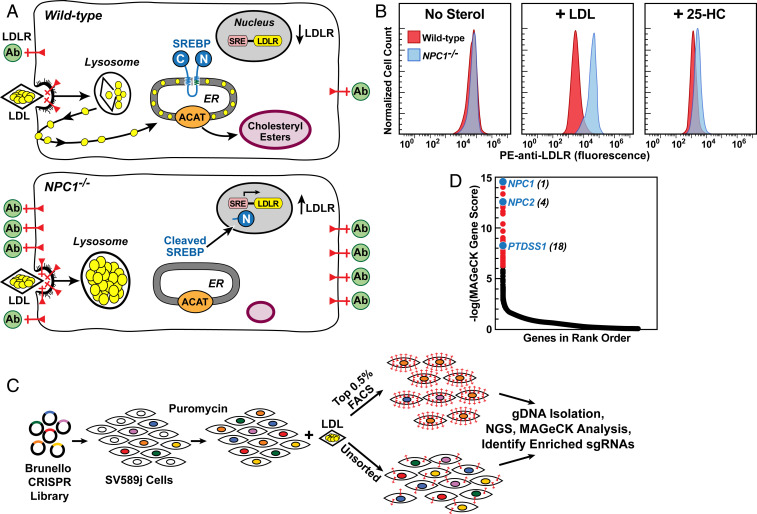
Fig. 1.
Strategy for CRISPR-Cas9 screen for genes required for transport of LDL-derived cholesterol. (A) Overall strategy. In WT cells (Upper), LDL delivers cholesterol to lysosomes, and NPC2 and NPC1 transport cholesterol out of lysosomes. Cholesterol reaches the ER, where it blocks SREBP cleavage, leading to a reduction in LDLRs (red) and decreased binding of fluorescent anti-LDLR antibodies (green). Excess ER cholesterol is esterified by ACAT and stored in cholesteryl ester droplets. In NPC−/− cells (Lower), LDL-derived cholesterol is trapped in lysosomes, SREBP is cleaved, LDLRs increase and anti-LDLR binding is high. Cells fail to synthesize cholesteryl esters. (B) Measurement of LDLRs by flow cytometry in WT and NPC1−/− SV589 cells incubated with LDL or 25-hydroxycholesterol (25-HC). On day 0, cells were set up in medium A with 5% FCS. On day 1, cells were switched to cholesterol-depletion medium A. After 16 h, cells were refed with the same cholesterol-depletion medium in the absence (Left) or presence of 50 µg protein/mL human LDL (Middle) or 0.3 µg/mL 25-HC (Right). After 24 h, cells were harvested, incubated with PE-anti-LDLR, and assessed by flow cytometry (SI Appendix, Materials and Methods). (C) CRISPR-Cas9 screen for genes required for transport of LDL-derived cholesterol to ER. SV589j cells were infected with the Brunello CRISPR Knockout Library in lentiCRISPRv2 at a low multiplicity of infection and subjected to puromycin selection for approximately 10 d. Surviving cells were cultured in the presence of LDL, incubated with PE-anti-LDLR, and subjected to FACS (SI Appendix, Materials and Methods). Genomic DNA was isolated from sorted cells expressing the most LDLRs (top 0.5% of cells) and from ∼40 × 106 unsorted cells. DNA was subjected to next-generation sequencing), and the data were analyzed by MAGeCK to identify sgRNAs overrepresented in the top 0.5% of cells (SI Appendix, Materials and Methods and Fig. S1). (D) Ranking of genes (19,114 total) in sorted cells expressing the most LDLRs compared with unsorted cells. The y-axis denotes negative log of the robust rank aggregation score as calculated by MAGeCK (Dataset S1). NPC1 was the gene with the highest rank (i.e., greatest enrichment).

