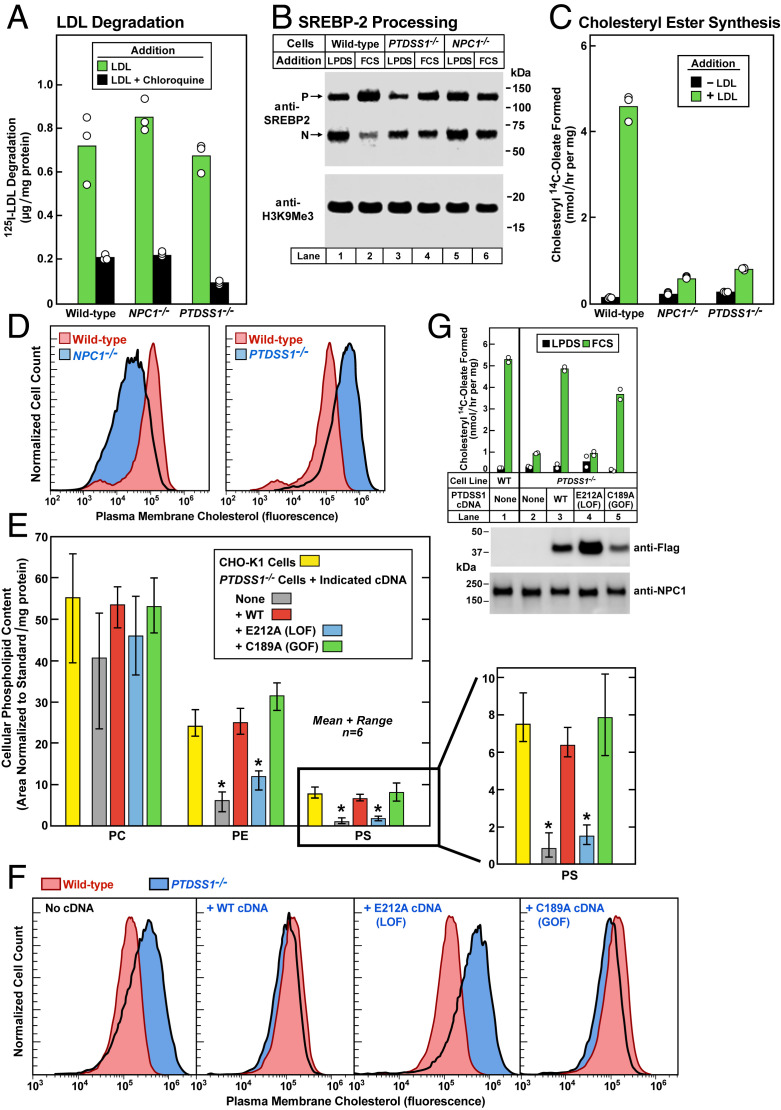
Fig. 3.
PTDSS1 cDNA restores transport of LDL-derived cholesterol in PTDSS1−/− cells. (A–C) 125I-LDL degradation, LDL-mediated regulation of SREBP processing, and LDL-mediated stimulation of cholesteryl ester synthesis in WT, NPC1−/−, and PTDSS1−/− CHO-K1 cells. On day 0, cells were set up in medium C with 5% FCS. Each bar in A–C represents the average of duplicate incubations, with individual values shown. (A) 125I-LDL degradation. On day 2, cells were switched to cholesterol-depletion medium C. After a 16-h incubation, cells were refed with cholesterol-depletion medium D containing 30 μg protein/mL of 125I-LDL (45 cpm/ng protein) in the absence or presence of 100 μM chloroquine. After 5 h, the amount of 125I-monoiodotyrosine in the medium was measured. (B) SREBP processing. On day 2, cells were switched to cholesterol-depletion medium C. After a 16-h incubation, the cells received medium D containing (CPN/MEV) and either 5% calf LPDS or 10% FCS as indicated. After 6 h, cells were harvested for immunoblotting of SREBP-2 and H3K9Me3 (SI Appendix, Materials and Methods). P, precursor. N, nuclear. (C) Cholesteryl ester synthesis. On day 2, cells were switched to cholesterol-depletion medium C. After incubation for 12 h, the cells received cholesterol-depletion medium D in the absence or presence of 50 μg protein/mL LDL. After incubation for 4 h, the cells were pulse-labeled for 2 h with 0.1 mM sodium [14C]oleate (10,379 dpm/nmol), after which the cellular content of cholesteryl [14C]oleate was measured. (D) Measurement of PM cholesterol by flow cytometry in WT, NPC1−/−, and PTDSS1−/− CHO-K1 cells incubated with serum containing LDL. On day 0, cells were set up in medium C with 5% FCS. On day 2, cells were switched to cholesterol-depletion medium C. After a 16-h incubation, cells received medium D containing compactin plus mevalonate (CPN/MEV) and 10% FCS. After 6 h, cells were harvested for flow cytometry analysis using AF488-labeled PFO*. The same WT control histogram is shown in both panels for reference. (E) Phospholipid content in WT and PTDSS1−/− CHO-K1 cells expressing lentiviral-transduced cDNAs encoding WT, E212A, and C189A variants of human PTDSS1. Cells were plated as in D. After 3 d, cells were harvested for analysis of phospholipid content by liquid chromatography-tandem mass spectrometry (LC-MS/MS) (SI Appendix, Materials and Methods) and normalized to protein content. Each bar represents mean and range of six incubations. Statistical analysis was performed using Student’s t test; *P < 0.0001, when the indicated bar is compared with CHO-K1 cells. An expanded view of the PS content is shown at the right (SI Appendix, Table S2). (F) Measurement of LDL-derived cholesterol by flow cytometry in PMs of WT and PTDSS1−/− CHO-K1 cells expressing lentiviral-transduced cDNAs encoding WT, E212A, and C189A variants of human PTDSS1. On day 0, cells were set up in medium C with 5% FCS. On day 2, cells were switched to cholesterol-depletion medium C. After a 16-h incubation, the cells received medium D containing CPN/MEV supplemented with 10% FCS. After 6 h, cells were harvested, incubated with AF488-labeled PFO*, and examined by flow cytometry. The same WT control histogram is shown in all panels for reference. LOF, loss-of-function; GOF, gain-of-function. (G) Cholesterol esterification activity (Top) and immunoblots (Bottom) of WT and PTDSS1−/− CHO-K1 cells expressing cDNAs encoding Flag-tagged human WT, E212A, and C189A PTDSS1. On day 0, cells were set up in medium C with 5% FCS. On day 2, cells were switched to cholesterol-depletion medium C. After a 12-h incubation, cells received medium D with CPN/MEV supplemented with either 5% calf LPDS (black bar) or 10% FCS (green bar). After 4 h, cells were pulse-labeled for 2 h with 0.1 mM sodium [14C]oleate (8699 dpm/nmol), after which the cellular content of cholesteryl [14C]oleate was measured. Each bar represents average of duplicate incubations with individual values shown. (Bottom) Representative immunoblots of Flag-tagged PTDSS1 in the above cell lines.

