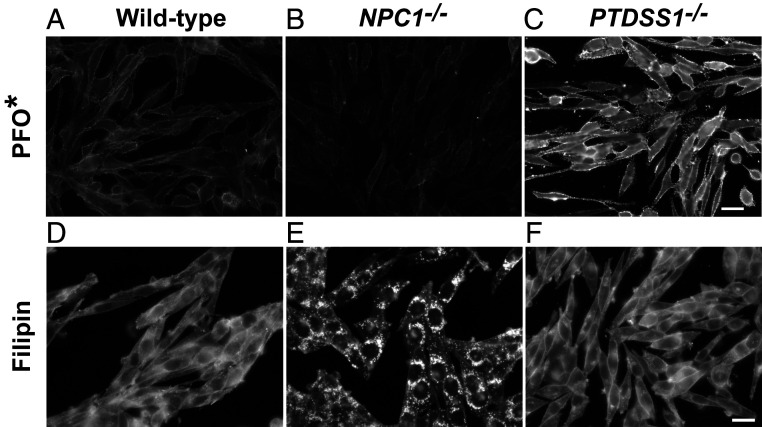
Fig. 5.
Difference in cholesterol distribution in NPC1−/− and PTDSS1−/− cells as assessed by fluorescence microscopy. (A–C) PM cholesterol. On day 0, WT, NPC1−/−, and PTDSS1−/− CHO-K1 cells were plated on 12-mm glass coverslips in medium C with 5% FCS. On day 2, cells were switched to cholesterol-depletion medium C. After a 12-h incubation, cells were switched to medium D containing CPN/MEV and supplemented with 10% FCS. After 6 h, cells were imaged using AF-488–conjugated PFO* (Scale bar: 20 µm.) (D–F) Total cellular cholesterol. Cells were set up and incubated as above and then imaged with filipin (SI Appendix, Materials and Methods) (Scale bar: 20 µm.)

