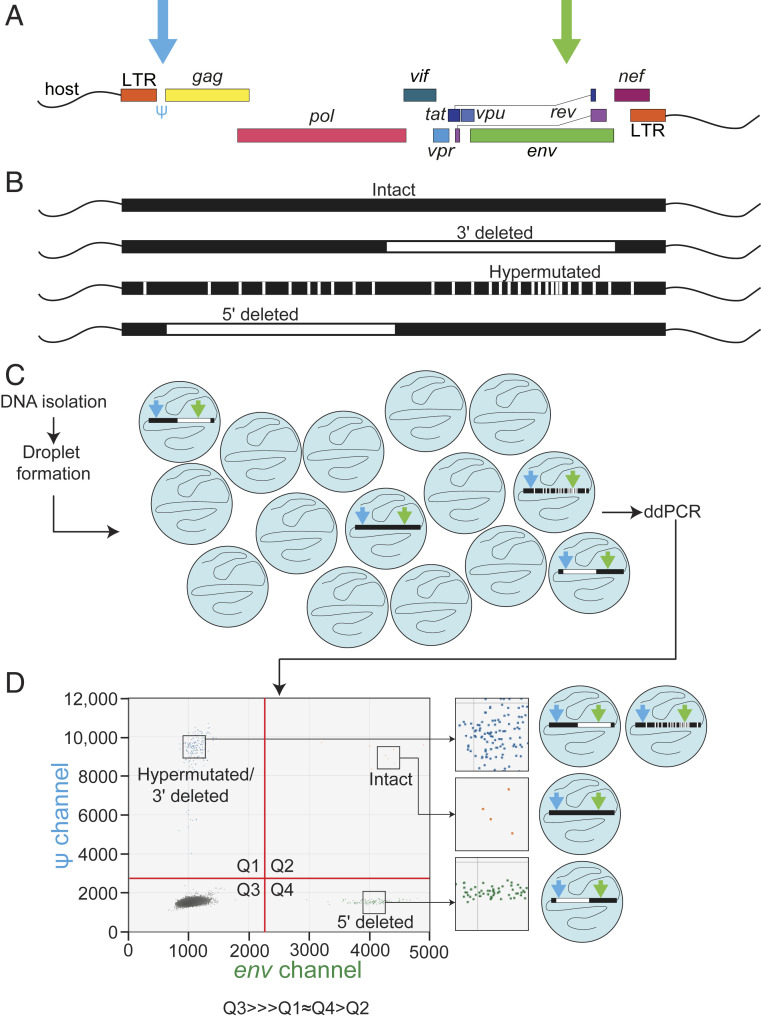
Fig. 1.
Overview of the IPDA (A) Map of the HIV-1 genome indicating positions of the Ψ (blue arrow) and env (green arrow) amplicons. (B) Illustration of the common types of fatal defects detected by the IPDA. Precision maps of sequenced proviruses are available elsewhere (5, 8, 9). (C) Overview of the IPDA. In addition to the HIV-1 proviral discrimination reaction illustrated here, the IPDA includes a parallel ddPCR reaction targeting a host gene to allow determination of input cell number and correction for shearing between Ψ and env amplicons (9, 19). (D) Representative 2D ddPCR plot from the HIV-1 proviral discrimination component reaction of the IPDA. The typical droplet counts follow the pattern Q3 >>> Q1 ∼ Q4 > Q2.

