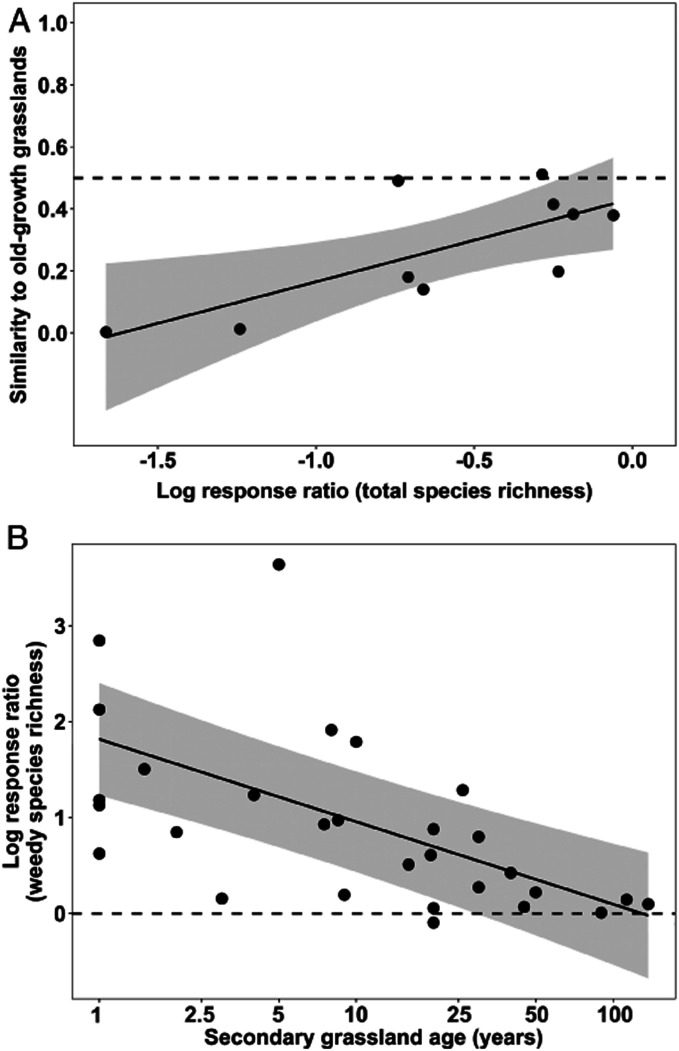
Fig. 4.
Indicators of plant community composition in relation to secondary grassland species richness and age. (A) Relationship between the lnRR of total species richness and the compositional similarity between secondary and old-growth grassland communities. Data are from n = 10 studies that reported similarity indices. The regression equation, similarity = 0.2681(lnRR) + 0.4332 (R2 = 0.536, P = 0.016), is displayed as a solid black line; gray shading indicates the 95% CI. The horizontal dashed line (similarity = 0.5) indicates the level at which secondary grasslands are 50% similar to old-growth grasslands in species composition. At lnRR = 0, secondary and old-growth grasslands are equal in total species richness. (B) Relationship between the lnRR of weedy species richness and age of secondary grasslands. The mixed-effects regression model is based on the n = 11 studies (random effect) that reported weedy species richness for n = 29 timepoints (age as fixed effect). The regression equation, lnRR = −0.8597 (log10[secondary grassland age]) + 1.8164 (R2 = 0.274, P < 0.0001), is displayed as a solid black line; gray shading indicates the 95% CI. At lnRR = 0, secondary and old-growth grasslands are equal in weedy species richness.

