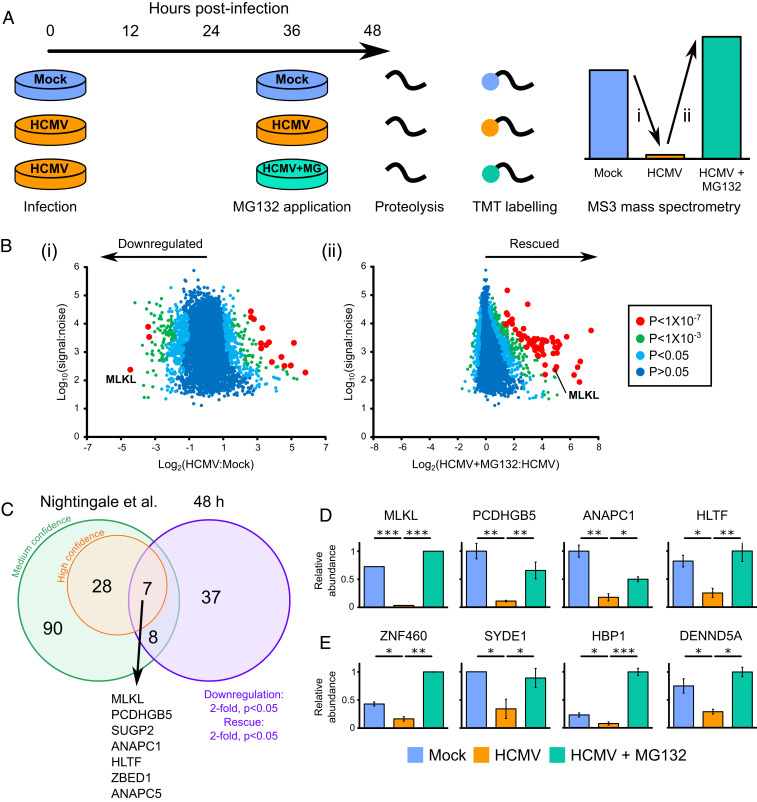
Fig. 2.
Identification of proteins targeted for degradation by HCMV at 48 hpi. (A) Schematic of the experimental method, conducted in biological duplicate. Cellular lysates from the second 48-h biological replicate were analyzed simultaneously with residual lysates from the 12-h degradation screen in the Nightingale et al. (10) study, facilitating a direct comparison (SI Appendix, Fig. S1A). Peptides from each sample were labeled with tandem mass tags and analyzed by MS3 mass spectrometry. (B) Scatterplots of human proteins quantified at 48 hpi in one or both replicates, showing averaged ratios. P values were estimated using significance B values, then corrected for multiple hypothesis testing (24). K-means clustering suggested there were at least nine different patterns of protein expression across the samples (Dataset S1C and SI Appendix, Fig. S1B). (C) Overlap between early degradation data from the Nightingale et al. (10) study (using either stringent or sensitive statistical criteria) and 48 h degradation data presented in this study. (D) Examples of the seven proteins degraded with high confidence both early and late during infection. MLKL was only quantified in one replicate. Error bars: range. P values were calculated as described in B. *P < 0.05, **P < 0.001, ***P < 1 × 10⁻⁷. Additional proteins were likely to have been degraded both early and late during infection (Dataset S1 and SI Appendix, Fig. S1A), but did not pass the stringent filtering criteria used at one or other of the time points. (E) Examples of the 37 proteins degraded at 48 h that were not confidently degraded at early time points. These comprised: 1) proteins not degraded at early time points (shown in this figure), 2) proteins that were insufficiently degraded at early time points to pass filtering criteria, and 3) proteins not quantified in the Nightingale et al. (10) study. Additional examples and the corresponding 12 h data are shown in SI Appendix, Fig. S1A.

