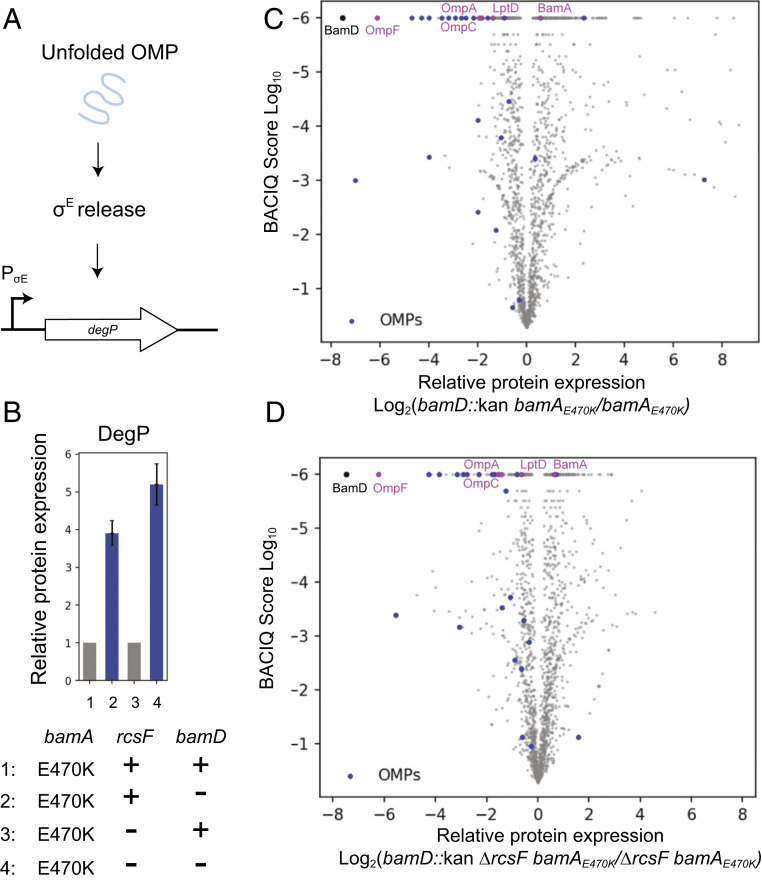
Fig. 3.
OMP assembly profiles of ΔbamD strains. (A) Schematic of σE activation. Unfolded OMPs in the periplasm trigger a proteolytic cascade that releases σE from the IM to activate regulon gene expression. (B) Relative fold change of DegP levels in the bamD::kan bamAE470K strain compared with the bamAE470K control and in the bamD::kan ΔrcsF bamAE470K strain compared with the ΔrcsF bamAE470K control. Whiskers represent 95% confidence intervals (27, 31). (C and D) Volcano plot of protein expression in the bamD::kan bamAE470K (27) (C) and bamD::kan ΔrcsF bamAE470K (D) strains compared with their respective isogenic controls, as indicated. The vertical axis represents the probability of observing differential protein expression between the two strains (31), and the horizontal axis is log2- fold change of protein abundance. Each dot represents an individual protein, with β-barrel OMPs in blue, commonly studied β-barrel OMPs in magenta, and BamD in black.

