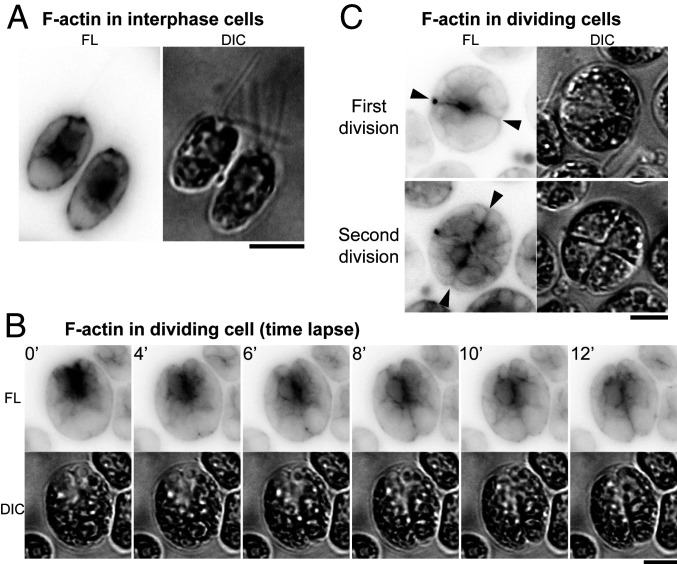
Fig. 2.
F-actin localization to the region of the cleavage furrow. Wild-type cells expressing Lifeact-mNG were imaged; fluorescence (FL) and DIC images are shown. Fluorescence images are presented with contrast inverted for greater clarity. (A and C) Still images of (A) interphase and (C) dividing cells grown on TAP medium at 26 °C. (B) Time-lapse images (as in Fig. 1A) showing association of F-actin with the region of the cleavage furrow. Arrowheads, ingressing furrows. (Scale bars, 5 µm.)

