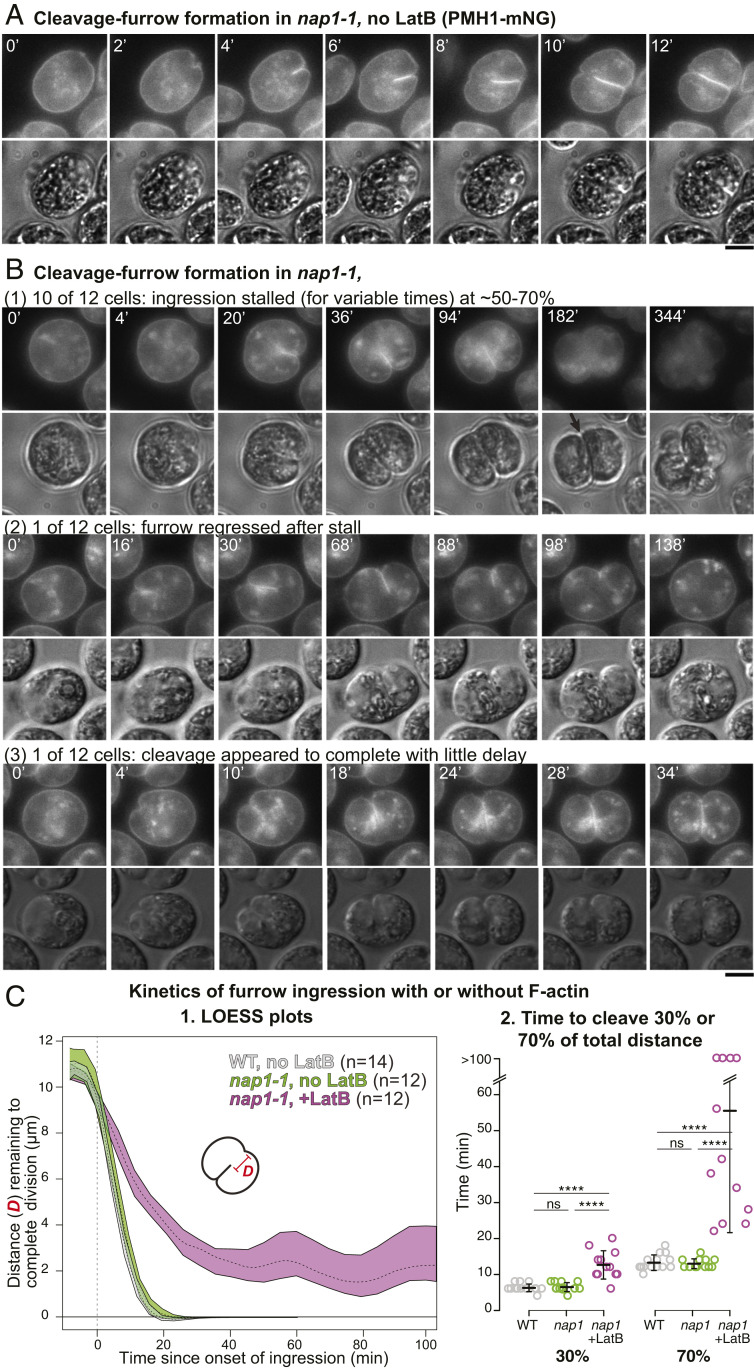
Fig. 5.
Slower cleavage-furrow ingression and delay in furrow completion in the absence of F-actin. (A) The nap1-1 cells expressing PMH1-mNG were synchronized using the 12L:12D/TAP agar method and observed by time-lapse microscopy at 26 °C. The full series is presented in Movie S3. (Scale bar, 5 µm.) (B) As in A except that 3 µM LatB was added 120 min to 160 min before the first frames shown. Selected images are shown to illustrate the different time scales; full series are presented in Movies S4–S6. (Scale bar, 5 µm.) (C) Kinetics of furrow ingression in wild-type cells without LatB (Fig. 1A and Movie S2) and in nap1-1 cells with or without 3 µM LatB. Data are from the experiments shown in A and B. (1) Distance of the leading edge of the medial furrow from the opposite side of the cell as a function of time since the onset of furrow ingression (set at 0). Means and 95% CIs of 1,000×-bootstrapped locally estimated scatterplot smoothing (LOESS) curves are shown (see Materials and Methods). The curves for individual cells are shown in SI Appendix, Fig. S3 C. (2) Times for the furrow to reach 30% or 70% of the total distance across the cells. Because of mNG bleaching after prolonged time-lapse observations, cleavage times were capped at 100 min for these analyses. Bars indicate means and SDs. Statistical analyses were performed using one-way ANOVA and Tukey’s post hoc multiple comparisons (ns, not significant; ****P < 0.0001).

