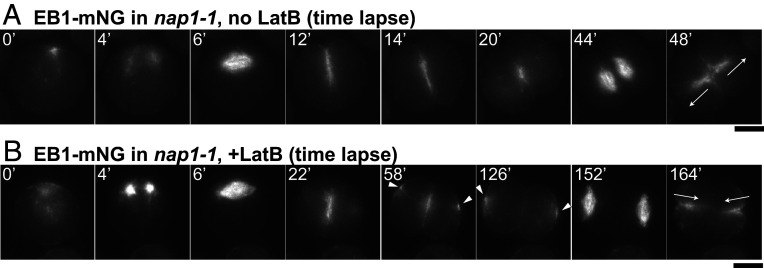
Fig. 6.
Persistent association of MTs with cleavage furrows, but changes in polarity during the second division, in the absence of F-actin. The nap1-1 cells expressing EB1-mNG to visualize MTs were synchronized using the 12L:12D/TAP agar method and observed by time-lapse microscopy at 26 °C. Selected images are shown; full series are presented in Movies S7 and S8. (A) A cell not treated with LatB. (B) A cell treated with 3 µM LatB beginning ∼20 min before the first frame shown. Arrowheads, aberrant foci of EB1-mNG at positions distal to the cleavage furrow in cells lacking F-actin; arrows, the directions of furrowing during the second division of each cell. (Scale bars, 5 µm.)

