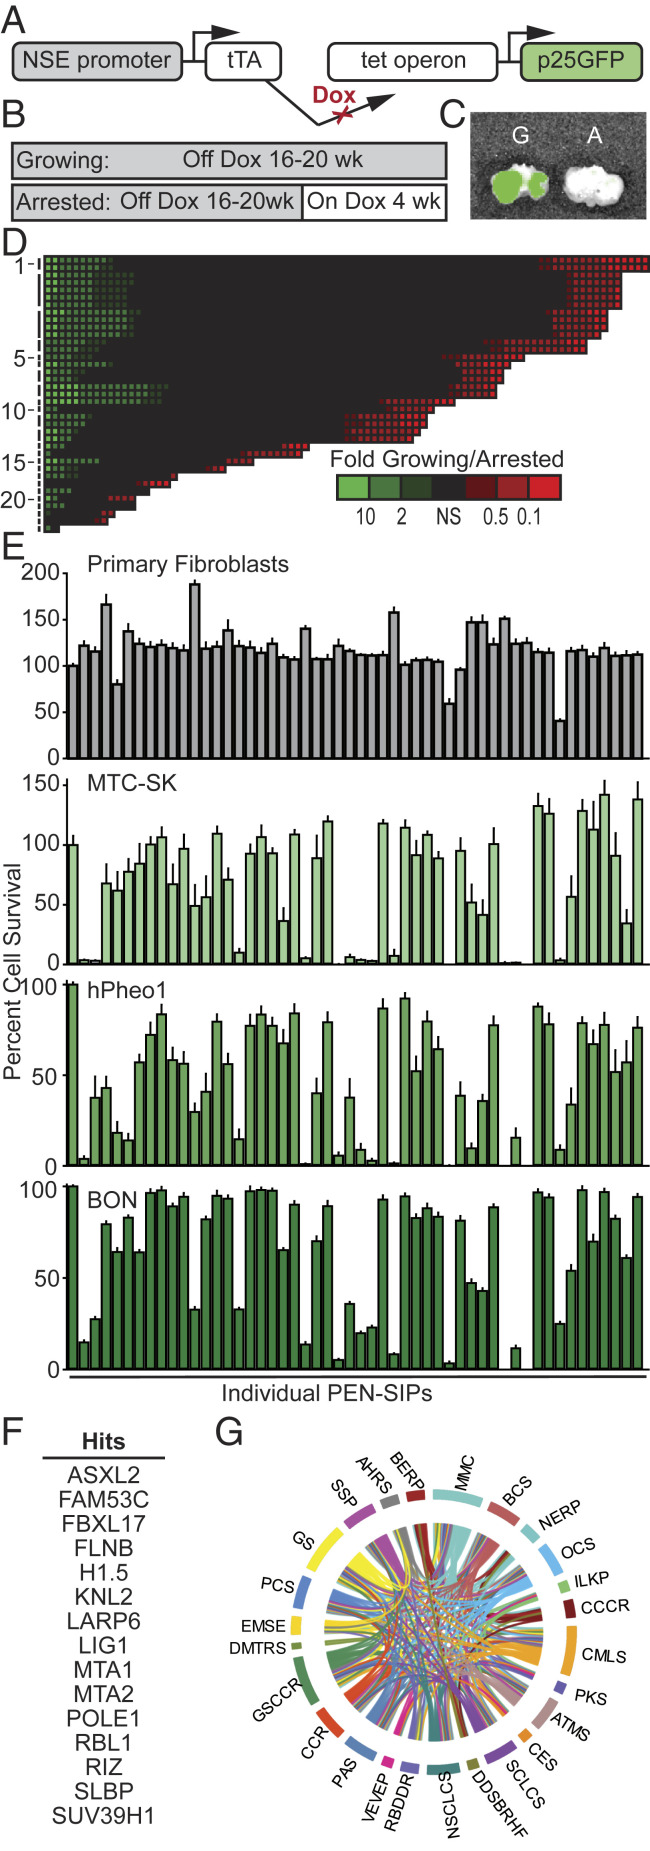
Fig. 3.
Identification of potential tumorigenic phosphoprotein signaling pathways. (A) Schematic of bitransgenic system for regulated tissue-specific expression of p25GFP. (B) Diagram of induction paradigm for generation of growing and arrested tumor tissue. (C) Overlay of photograph and GFP fluorescence from analysis by IVIS Spectrum (PerkinElmer) of resected trachea/esophagus with bilateral growing (G) and arrested (A) tumor tissue. (D) Phosphoproteome of mouse MTC tumors represented as a heat map of phosphopeptide levels in growing vs. arrested tumors sorted by protein group as indicated in SI Appendix, Table S1 (73) (y axis) and fold change intensity (x axis). (E) Growth/survival assay of NE cell lines treated with control (0.3% DMSO) or the PEN-SIPs (30 μM) indicated in SI Appendix, Table S2. Error bars represent SEM (n = 7 to 8). (F) Hits selected from E. (G) IPA of hits from E.

