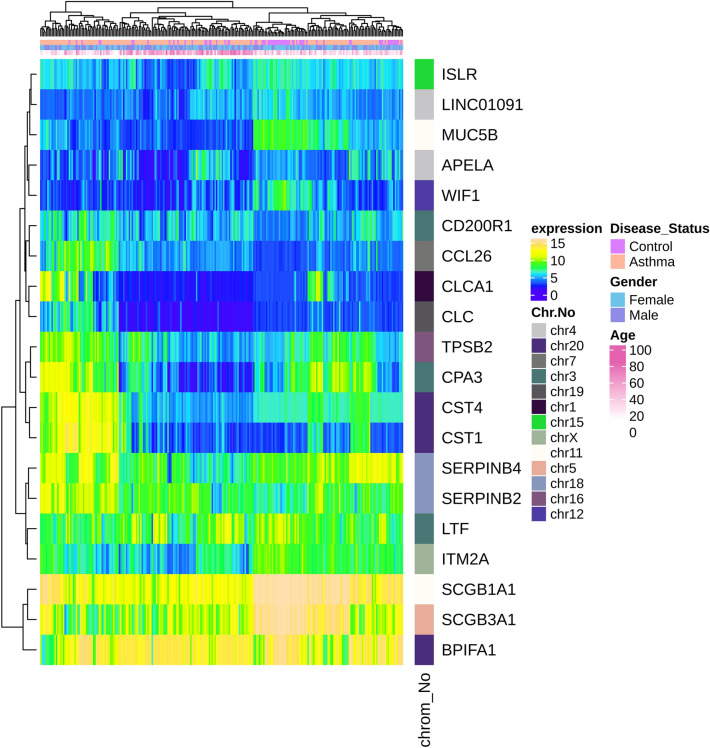
Figure 2.
Heatmap plot of top 10 up and downregulated DEGs in asthma. Expression values for each DEG (row) are normalized across all the samples (columns). Hierarchical clustering using Euclidean distances was employed for both rows and columns with cluster dendrograms presented along the left and top sides of the plot. The categorical annotation bars (above the heatmap) show the column annotations for age, gender and disease status. The location of each gene on its respective chromosome was shown in the right bar (color bands) as row annotation.

