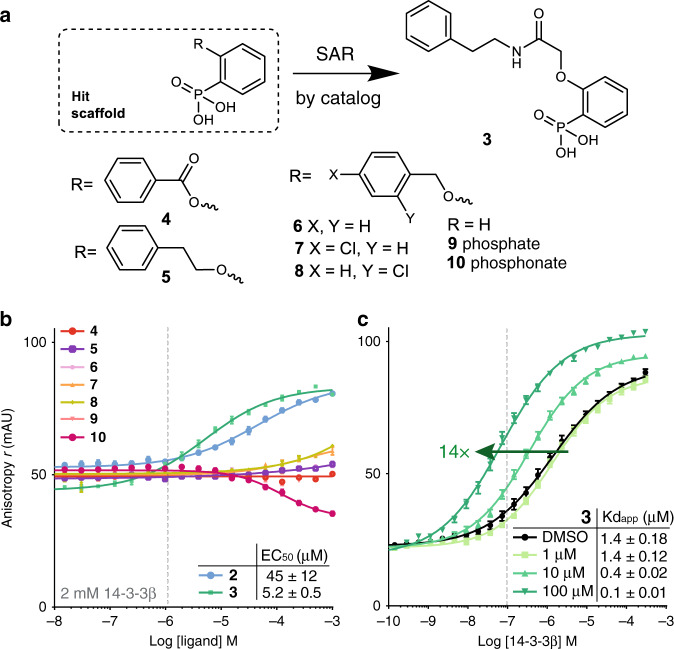
Fig. 2. Initial optimization via SAR-by-catalog of the hit scaffold 2-based series.
a Eight derivatives of 2 were selected for molecular docking and in vitro testing. Titration curves of b ligands on 2 μM 14-3-3β and 100 nM fluorescently-labeled ChREBP peptide, and c of 14-3-3β on 100 nM fluorescently-labeled ChREBP peptide in presence of increasing concentrations (1, 10, 100 μM) of compound 3. Data and error bars represent mean ± SEM, n = 3 replicates. Source data are provided as a Source data file.

