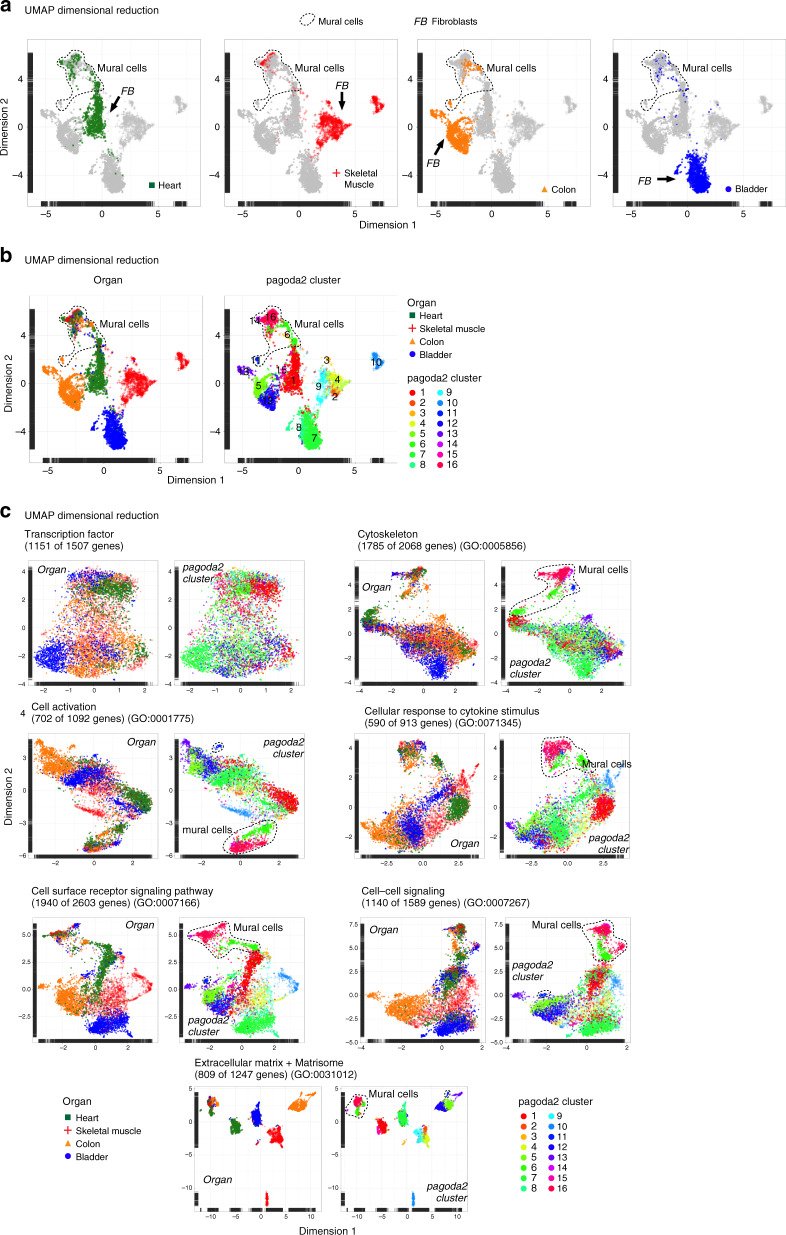
Fig. 2. Cell dispersion criteria.
a UMAP visualization of the complete dataset, color coded for th respective organ of origin, separately. Cell clouds containing mural cells or fibroblasts are indicated. b UMAP visualization color coded for the organ of origin or pagoda2 clustering result. c UMAP visualization using restricted gene-sets color coded for the organ of origin combined, or pagoda2 clustering result. Cell clouds containing mural cells are indicated (see also Supplementary Data 2).

