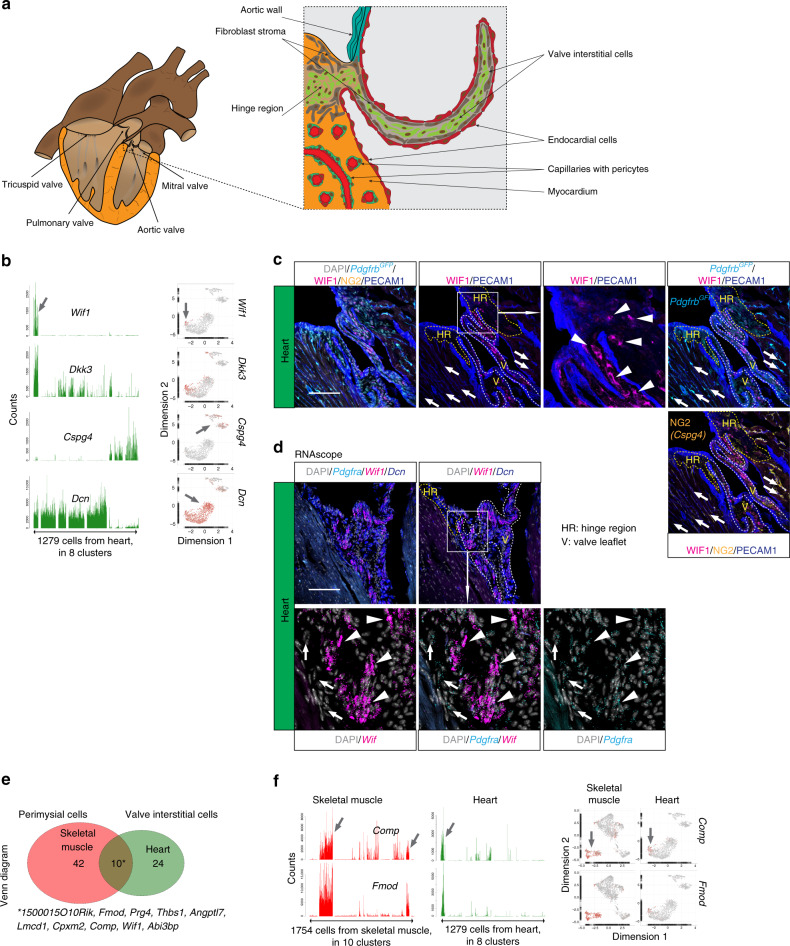
Fig. 4. Fibroblast subtypes of the heart.
a Schematic depiction of heart anatomy. b Bar plots and UMAP visualization (gray, low; red, high expression) showing examples of cell subtype-specific expression (arrow). c Immunofluorescence staining of heart from the PdgfrbGFP reporter line for WIF1, NG2, and PECAM1, focused on the cardiac valve and hinge region. d RNAscope staining for Pdgfra, Wif1, and Dcn, focused on the cardiac valve region. Arrowheads: valve interstitial cells; arrows: pericytes; HR: hinge region, V: valve leaflet. Scale bar: 100 µm. e Venn diagram showing skeletal muscle perimysial- and heart valve interstitial cell co-enriched genes. f Examples of co-enriched genes presented as bar plots and UMAP (gray, low; red, high expression). Asterisk: gene list of commonly enriched genes (see also Supplementary Table 2).

