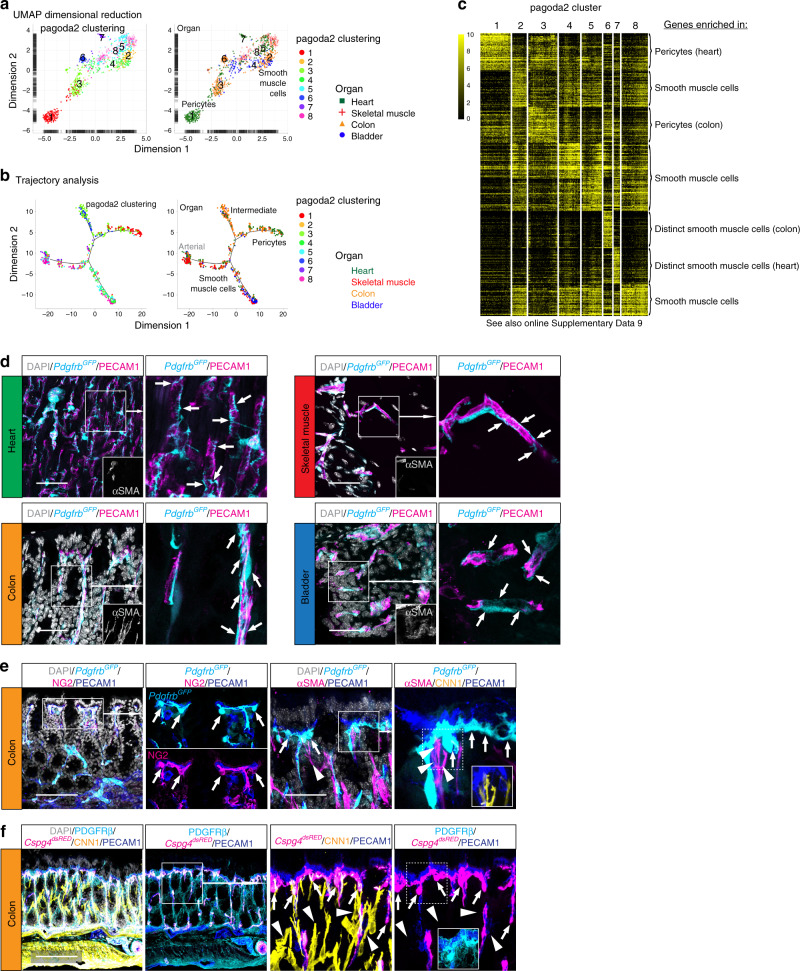
Fig. 7. Mural cell organotypicity.
a UMAP visualization of the mural cell dataset, color coded and annotated for pagoda2 clustering (left) or color coded for organ of origin and annotated for pagoda2 clustering (right). b Trajectory analysis plots of the mural dataset color coded for pagoda2 clusters (left) or organ of origin (right). c Expression heat map (black, low; yellow, high) of cluster enriched genes (see also Online Supplementary Data 9). d Samples from all four organs from the PdgfrbGFP reporter line, stained with immunofluorescence for αSMA and PECAM1. Arrows highlight pericytes and their morphological distribution at the organ-specific capillaries. Scale bars: 50 µm. e Immunofluorescence staining of colon samples from PdgfrbGFP reporter line for NG2 (Cspg4) and PECAM1 (left panel), or αSMA, CNN1 and PECAM1 (right panel). f Immunofluorescence staining of colon samples from Cspg4dsRED reporter line for PDGFRβ, CNN1 and PECAM1. Arrows highlight colon pericytes located at the subepithelial capillary loop, arrowheads indicate αSMA+ CNN1+, but Cspg4 (NG2)− interstitial SMC. Scale bars: e 100 µm (left panel f), 50 µm (e right panel).

