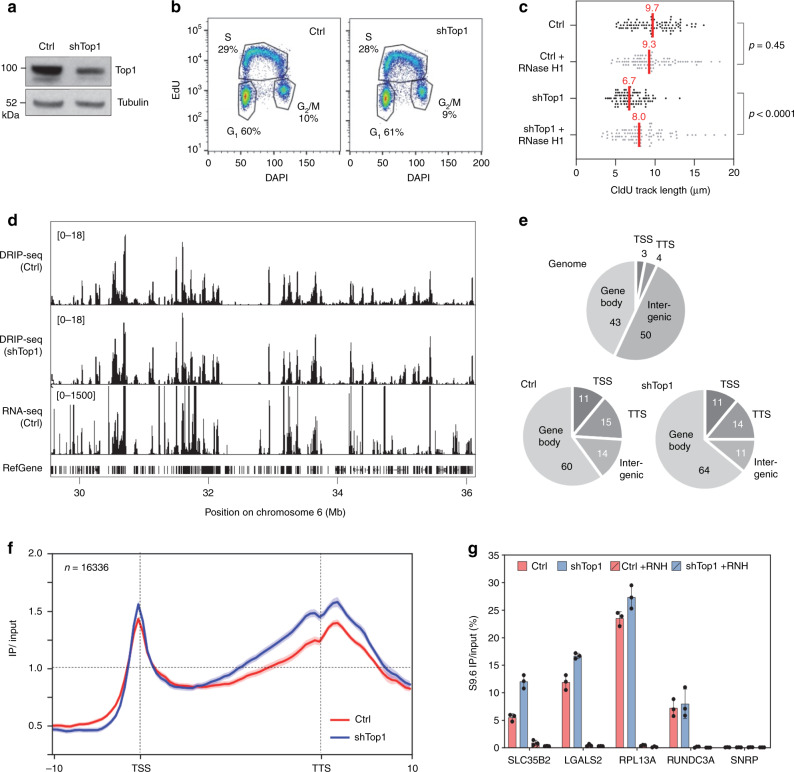
Fig. 1. Depletion of Top1 increases R-loop formation and slows down fork progression.
a Western blot analysis of Top1 levels in HeLa cells expressing shRNA targeting Top1 (shTop1) under the control of a doxycycline-inducible promoter at 72 h post-induction (n = 9). b Cell-cycle distribution of control and shTop1 cells determined by flow cytometry after labeling of S-phase cells with EdU. The fraction of cells in the different cell-cycle phases is indicated. See Supplementary Fig. 7 for gating strategy. c Doxycycline-treated control and shTop1 HeLa cells were transfected for 48 h with a mock vector (EGFP-N1) or human RNase H1-EGFP (+RNase H1) and were sequentially labeled with IdU and CldU for 20 min. Replication fork progression was measured using DNA fiber spreading as described in “Methods” section. The median length of CldU tracks is indicated in red. At least 150 fibers of each sample were measured (n = 3). P-values were calculated with the two-sided Mann–Whitney rank-sum test. d DRIP-seq analysis of the distribution of RNA:DNA hybrids expressed in RPKM (Read Per Kilobase per Million reads) in control and shTop1 HeLa cells. A representative region on chromosome 6 is shown. RNA-seq data (RPKM) for HeLa cells and gene positions (hg19) are also indicated. e Distribution of R-loop peaks relative to gene annotations in control and shTop1 HeLa cells. Peaks were obtained with MACS2 and were analyzed with CEAS (Cis-Regulatory Element Annotation System). The expected distribution in case peaks were randomly positioned in the genome is shown for comparison. The percentage of DRIP-seq signals present in each annotation class is indicated. TSS: Transcription Start Site (5′-UTR and 3 kb upstream). TTS: Transcription Termination Site (3′-UTR and 3 kb downstream). f Metaplot of the distribution of S9.6 signals (IP/input) along 16,336 active human genes (RPKM > 0) and flanking regions (±10 kb) in control (red) and shTop1 (blue) HeLa cells. Error bars correspond to SEM. g DRIP-qPCR analysis of the relative enrichment of RNA:DNA hybrids at the TTS of four genes and a negative control regions (SNPRN) in control and shTop1 HeLa cells after RNase H1 treatment (+RNH). Error bars correspond to three independent experiments.

