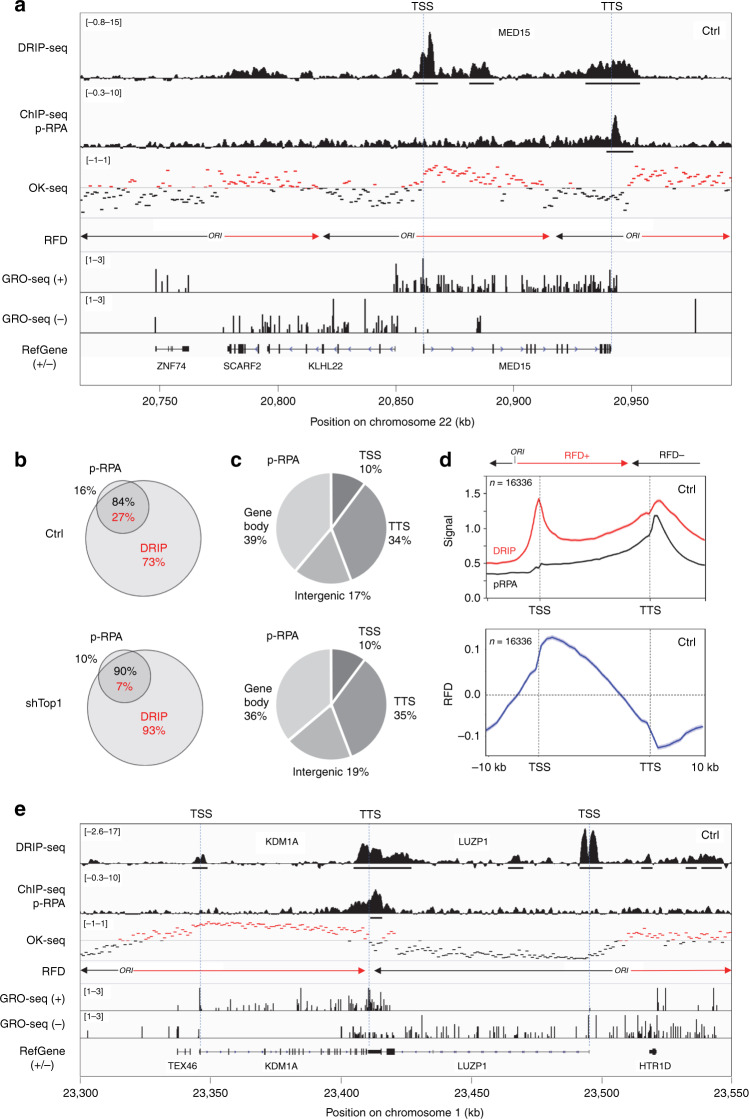
Fig. 2. Phospho-RPA accumulates at TTS in control and shTop1 cells.
a Distribution of RNA:DNA hybrids (DRIP-seq), p-RPA32 S33 (ChIP-seq), Okazaki fragments (OK-seq), and nascent transcription (GRO-seq) signals at a representative region on chromosome 22 in control HeLa cells. Replication fork direction (RFD) is derived from OK-seq data. The positions of TSS and TTS are indicated for the MED15 gene. The positions of DRIP and p-RPA peaks identified with MACS2 are also indicated. b Venn diagram of the percentage of genes overlapping with R-loop (red) and p-RPA peaks (black) peaks (MACS2) in control and shTop1 cells. c The distribution of p-RPA peaks was analyzed with CEAS as in Fig. 1e. The percentage of p-RPA peaks present in each region is indicated. d Metaplots of RNA:DNA hybrids (DRIP, red), p-RPA (black), and replication fork direction (RFD, blue) at 16,336 active genes in HeLa cells. Error bars indicate SEM. e Distribution of RNA:DNA hybrids (DRIP-seq), p-RPA32 S33 (ChIP-seq), Okazaki fragments (OK-seq), and nascent transcription (GRO-seq) signals at two converging genes on chromosome 1 in control HeLa cells. The positions of DRIP and p-RPA peaks identified with MACS2 are indicated.

