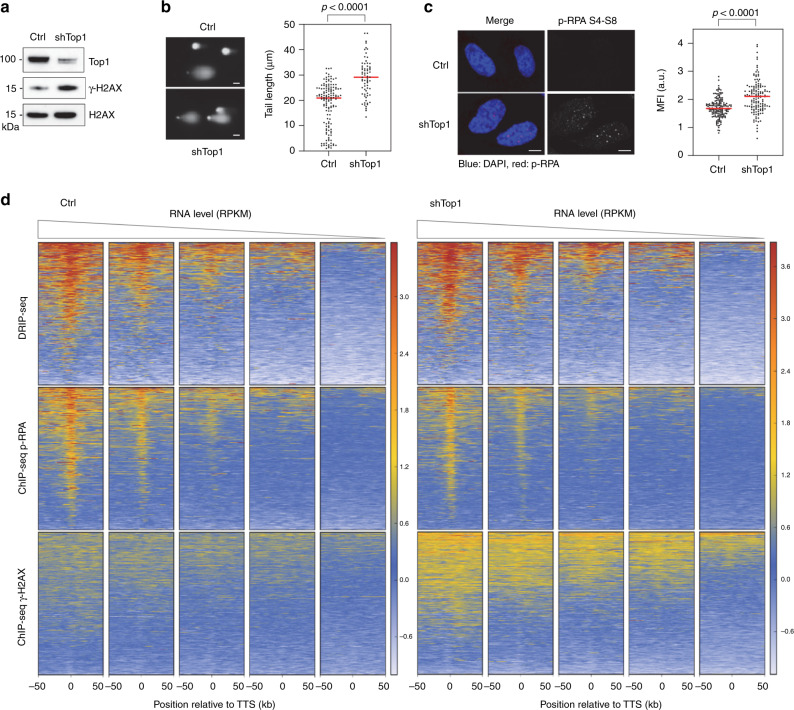
Fig. 3. Top1 prevents the accumulation of γ-H2AX at highly expressed genes.
a Western blot analysis of γ-H2AX levels in control and shTop1 cells (n = 3). b Analysis of DNA breaks in control and shTop1 cells. Representative images and the distribution of comet tail lengths are shown. Median of tail length is indicated in red. At least 50 cells of each sample were measured (n = 2). Bar is 10 µm. P-values were calculated with the two-sided Mann–Whitney rank-sum test. c Immunodetection of phospho-RPA32 S4/S8 in control and shTop1 cells. Mean fluorescence intensity (MFI) of the p-RPA32 S4/S8 signals is indicated in red. At least 400 cells of each sample were quantified (n = 3). P-values were calculated with the two-sided Mann–Whitney rank-sum test. Bar is 5 μm. d Heat map of the intensity of RNA:DNA hybrids (DRIP), p-RPA and γ-H2AX at TTS in control and shTop1 HeLa cells for five groups of genes with decreasing expression levels (RNA-seq). In each group, genes were sorted relative to the intensity of DRIP signal.

