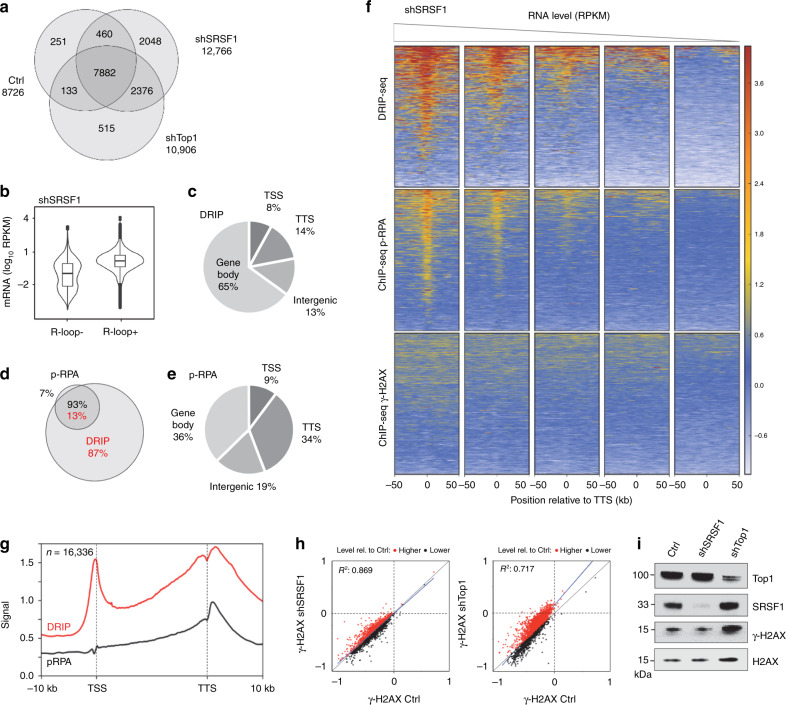
Fig. 4. Depletion of SRSF1 increases R-loop and p-RPA at TTS, but not γ-H2AX.
a Venn diagram of the number of genes enriched in R-loops in control, shSRSF1, and shTop1 cells. R-loop-positive genes correspond to genes overlapping with R-loop peaks identified with MACS2. b mRNA level (RPKM) of genes overlapping (R-loop+) or not (R-loop−) with S9.6 peaks in shSRSF1 cells. Box: 25th and 75th percentiles; central line: median. c Distribution of R-loop peaks in shSRSF1 cells relative to gene annotations. Peaks were obtained with MACS2 and were analyzed with CEAS (Cis-Regulatory Element Annotation System). d Venn diagram of the percentage of genes overlapping with R-loop (red) and p-RPA peaks (black) peaks (MACS2) in shSRSF1 cells. e Distribution of p-RPA (S33) peaks in shSRSF1 cells relative to gene annotations. f Heat map of the intensity of RNA:DNA hybrids (DRIP), p-RPA, and γ-H2AX at TTS in shSRSF1 cells for five groups of genes with decreasing mRNA levels (RPKM). Within each group, genes were sorted relative to the intensity of DRIP signal. g Metaplot of RNA:DNA hybrids (DRIP, red) and p-RPA (black) at 16,336 active genes in shSRSF1 cells. Error bars correspond to SEM. h Scatter plot of the intensity of γ-H2AX signal at all active genes in control, shSRSF1, and shTop1 cells. i Western blot analysis of γ-H2AX levels on chromatin in control, shSRSF1, and shTop1 cells. H2AX was used as a loading control (n = 3).

