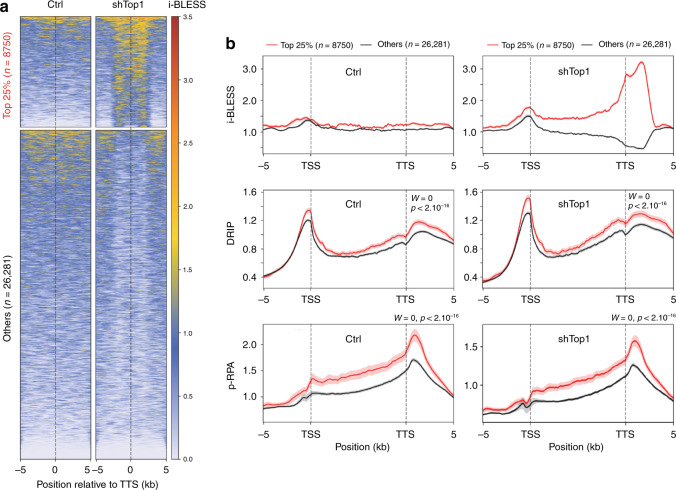
Fig. 5. DSBs form at TTS of genes enriched in R-loops and p-RPA in shTop1 cells.
a Heat map of the intensity of i-BLESS signal at TTS in control and shTop1 cells for two groups of genes determined according to the intensity of i-BLESS signal at the TTS (±2 kb) in shTop1 cells (Top 25%). b Metaplots of i-BLESS, RNA:DNA hybrids and p-RPA32 S33 signal for the Top 25% (red) and other (black) genes in control and shTop1 HeLa cells. Error bars indicate SEM. Differences in signal intensity at TTS ±2 kb were calculated with the Wilcoxon rank-sum test with continuity correction.

