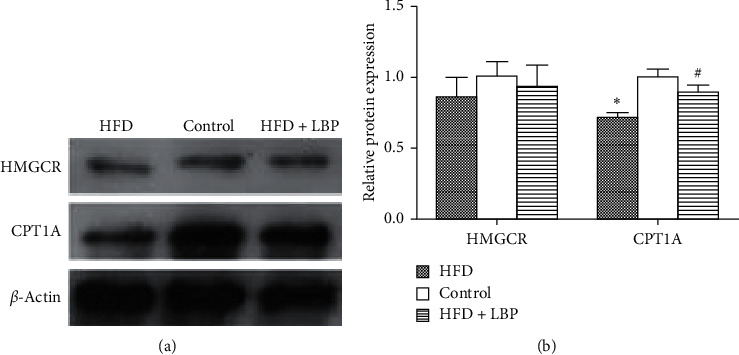
Figure 7.

Effect of LBP on proteins associated with insulin resistance in livers. Representative immunoblot (a) and quantification (b) of HMGCR and CPT1A in the control, HFD, and HFD + LBP group mice. ∗P < 0.05 vs. control. #P < 0.05 vs. HFD. HFD: high-fat diet; LBP: Lycium barbarum polysaccharide.
