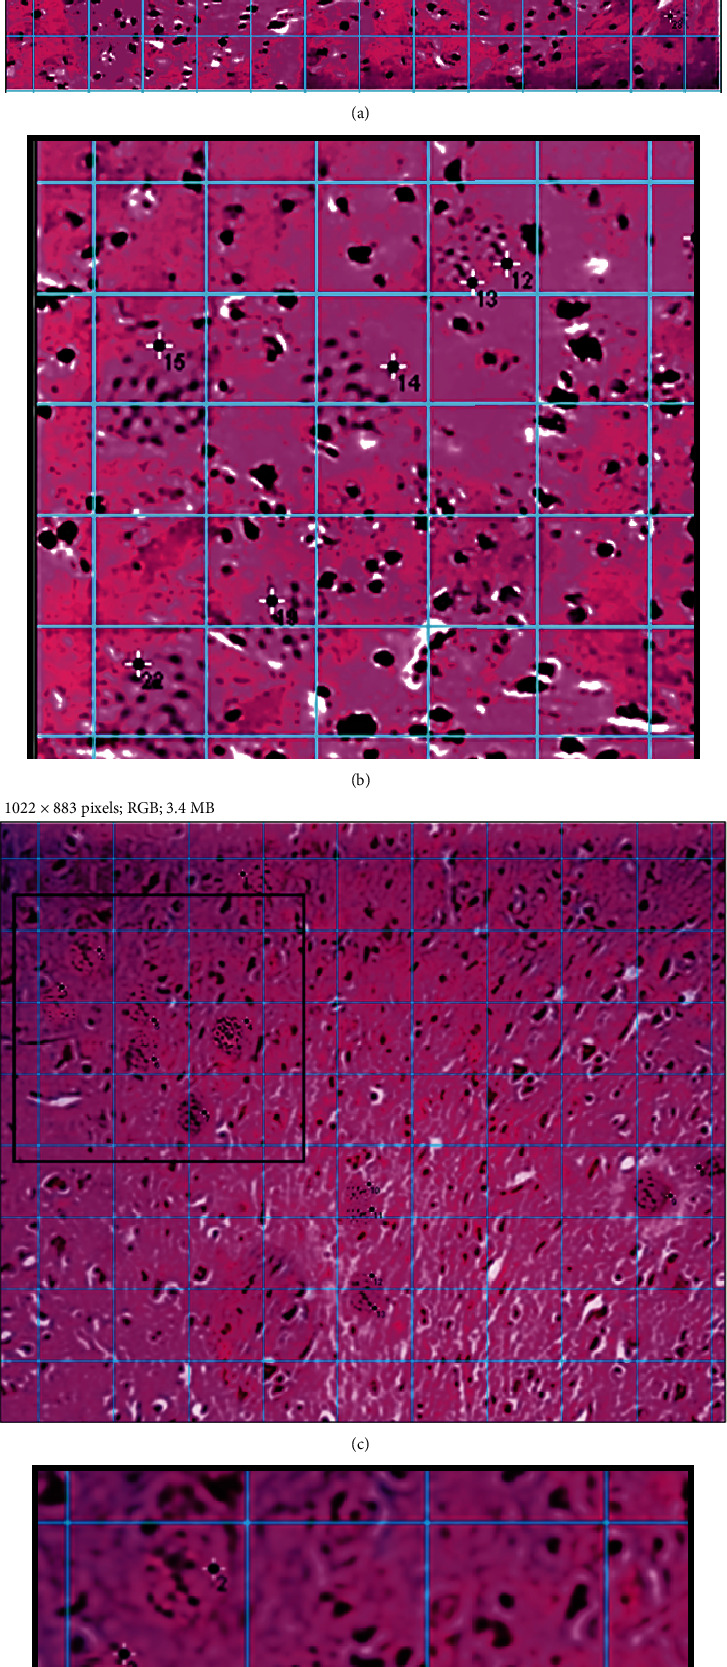
Figure 2.

Estimation process of the T. gondii cysts in brain tissue-cut sections stained with H&E in a magnification power (40x). Quantification was based on creating an image grid (in blue colour) with the ImageJ software and manual selection of the parasites (asterisk with numbers) within the boundaries of the grid. (a) A partial hippocampus region with clusters of cysts (28 cysts), and (c) shows separate cysts (13 cysts) in the amygdala region. Note that (b, d) are cropped magnified portions from (a) and (c), respectively.
