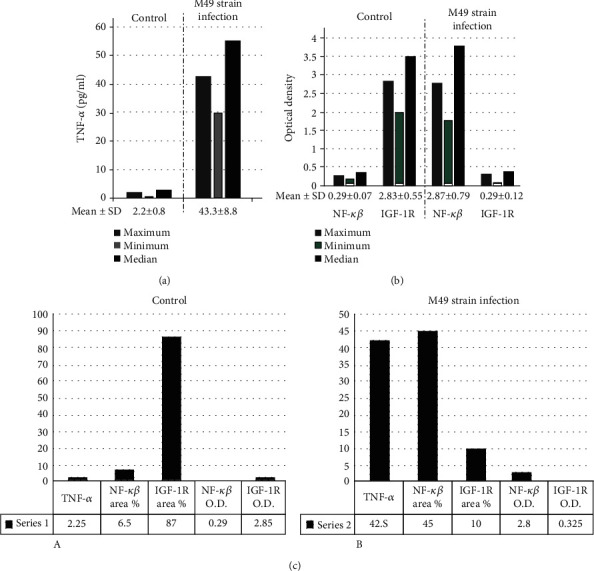
Figure 4.

In the form of median, maximum, minimum, and median values, the bar charts in (a) and (b) show a simple descriptive statistical analysis of different biomarkers on the 12th week post infection from the six chronically infected mice and healthy controls. (a) TNF-α (pg/ml) measured in the serum. (b) NF-κβ and IGF-1R intracerebral densitometry. (c) Using the mean values, the collaborative data of the biomarkers in the serum and the cerebral tissue microenvironment were shown involving TNF-α in pg/ml and NF-κβ and IGF-1R, area %, and O.D.
