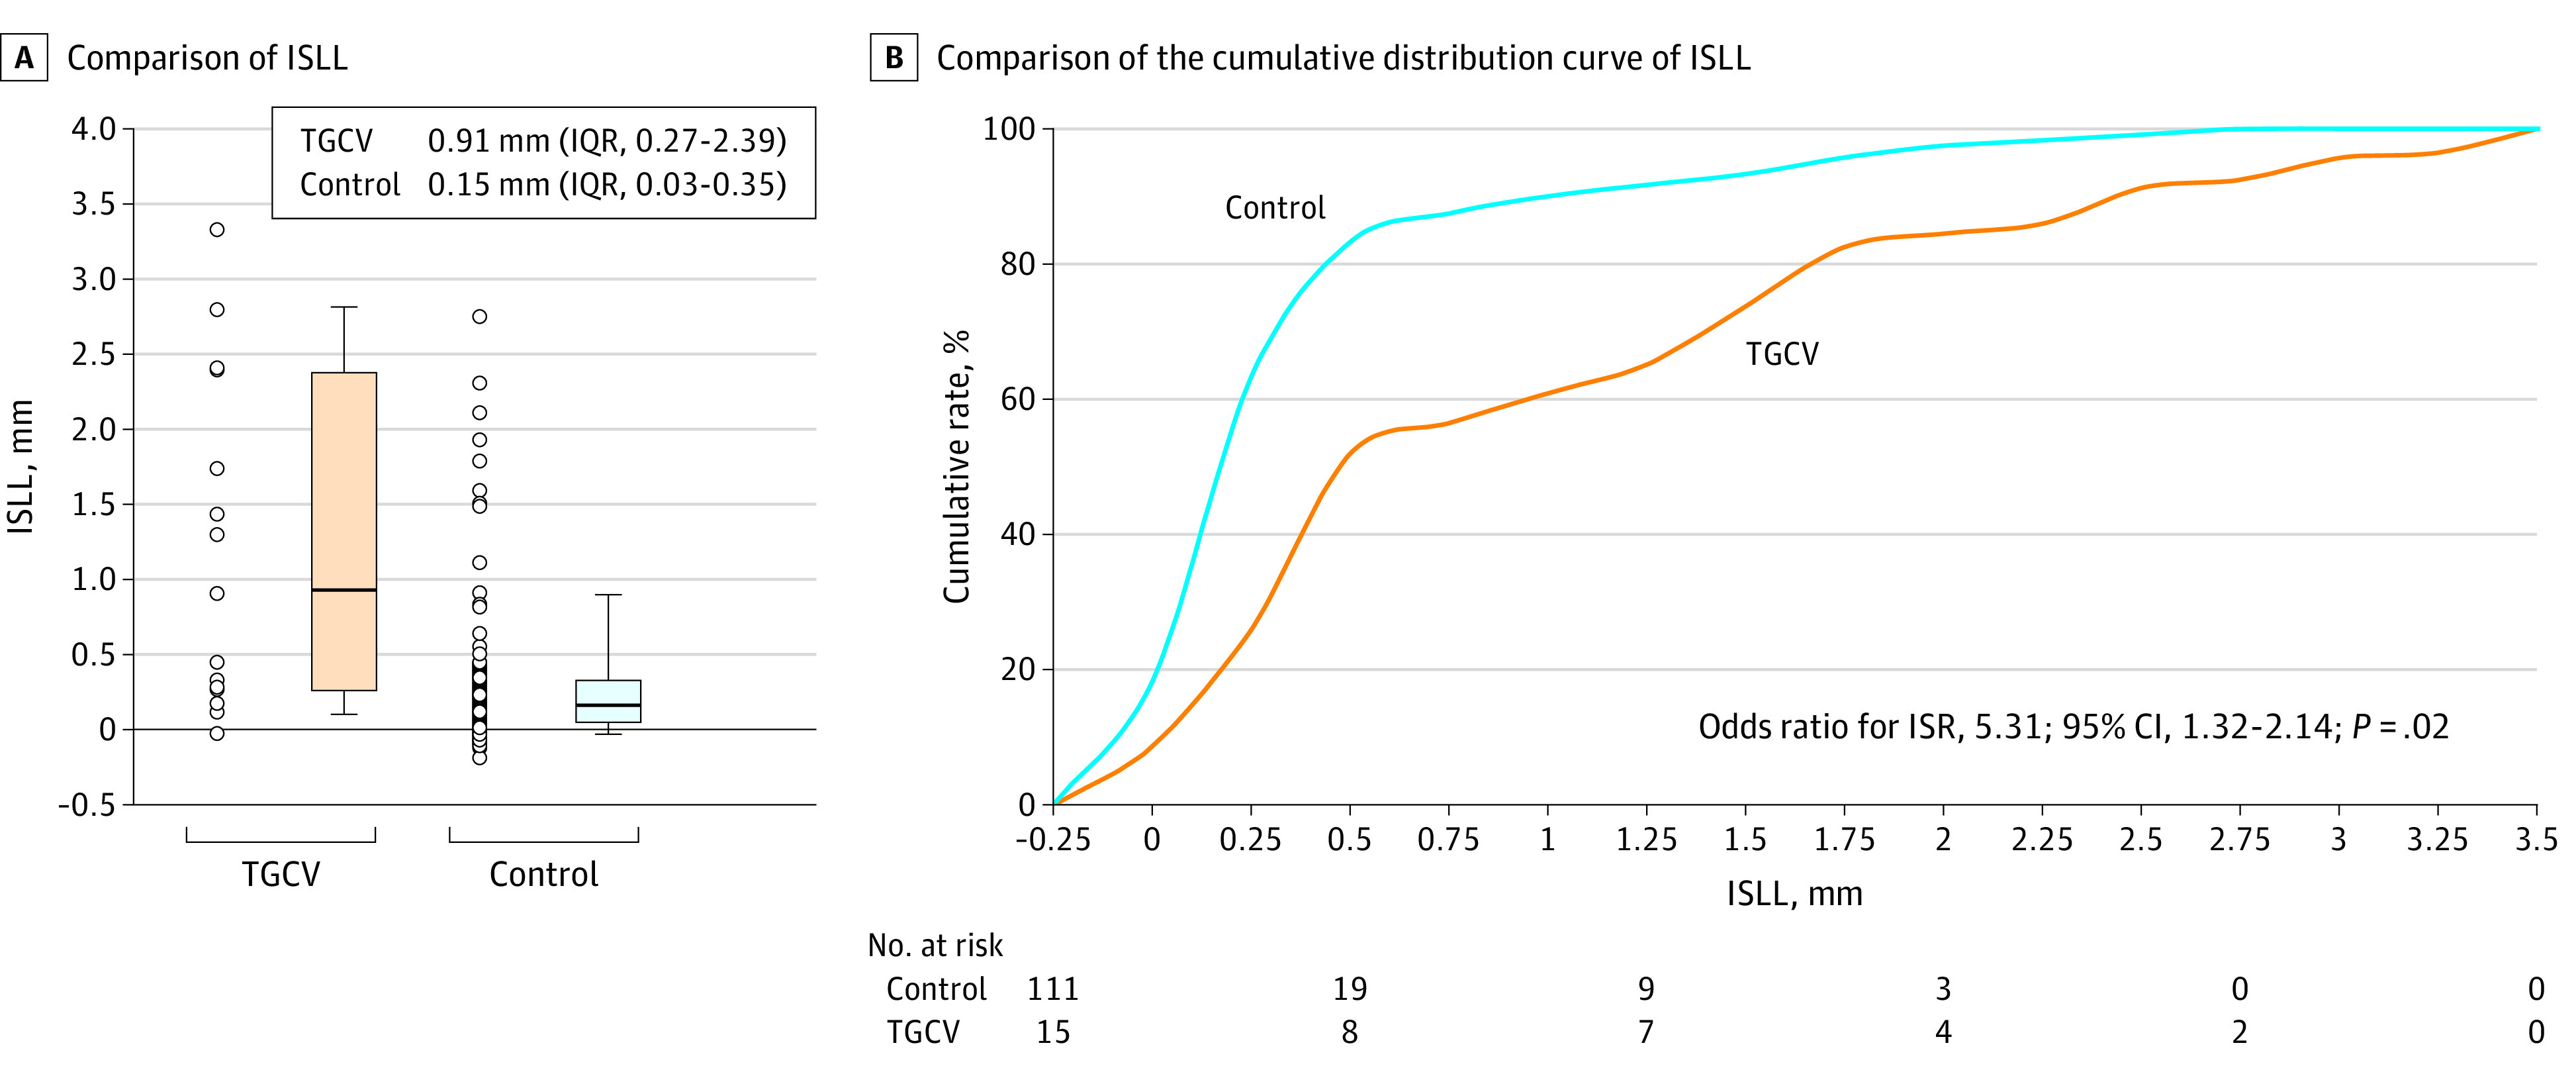
Figure. Comparison of ISLL and the Cumulative Distribution Curve of ISLL Between the TGCV and Control Groups.

A. ISLL, a parameter determined by caliper measurements using the known diameter of the angiographic catheter as a reference, was significantly higher in the TGCV group than in the control group. B. The cumulative distribution of ISLL revealed a greater value of ISLL in the TGCV group than in the control group. P value was calculated using ANCOVA with the following variables: American College of Cardiology/American Heart Association classification type B2/C, DES type, and TGCV diagnosis. ANCOVA indicates analysis of covariance; DES, drug-eluting stent; ISLL, in-stent late loss; IQR, interquartile range; ISR, in-stent restenosis; TGCV, triglyceride deposit cardiomyovasculopathy. P < .0001 vs control.
