
. 2020 Jul 24;7(7):e17541. doi: 10.2196/17541
©Matthew Fuller-Tyszkiewicz, Ben Richardson, Keriann Little, Samantha Teague, Linda Hartley-Clark, Tanja Capic, Sarah Khor, Robert A Cummins, Craig A Olsson, Delyse Hutchinson. Originally published in JMIR Mental Health (http://mental.jmir.org), 24.07.2020.
This is an open-access article distributed under the terms of the Creative Commons Attribution License (https://creativecommons.org/licenses/by/4.0/), which permits unrestricted use, distribution, and reproduction in any medium, provided the original work, first published in JMIR Mental Health, is properly cited. The complete bibliographic information, a link to the original publication on http://mental.jmir.org/, as well as this copyright and license information must be included.
Figure 1.
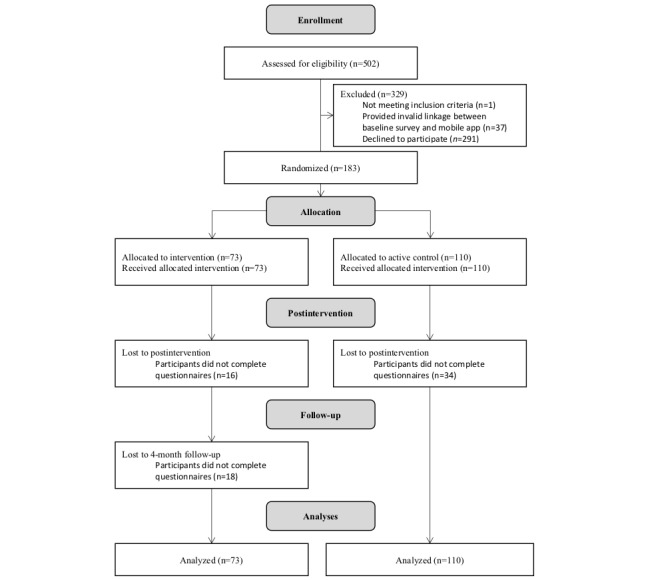
This Figure provides a CONSORT flow chart of participant numbers.