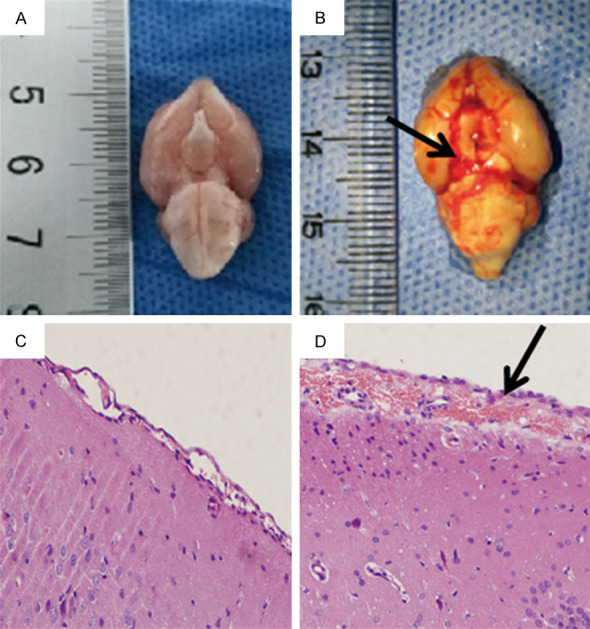
Figure 1.

Hematoxylin-eosin staining was used to identify the SAH model (×200). (A and C) represent macroscopic and microscopic observations of the control group, while (B and D) represent the SAH group. No blood clotting was observed in the control group (A), but clots are diffused throughout the brain cisterns in the SAH group (black arrow, B). The subarachnoid space was normal and no red blood cell aggregation was observed in the control group (C), but the SAH group showed a large amount of red blood cell aggregation in the expanded subarachnoid space (black arrow, D).
