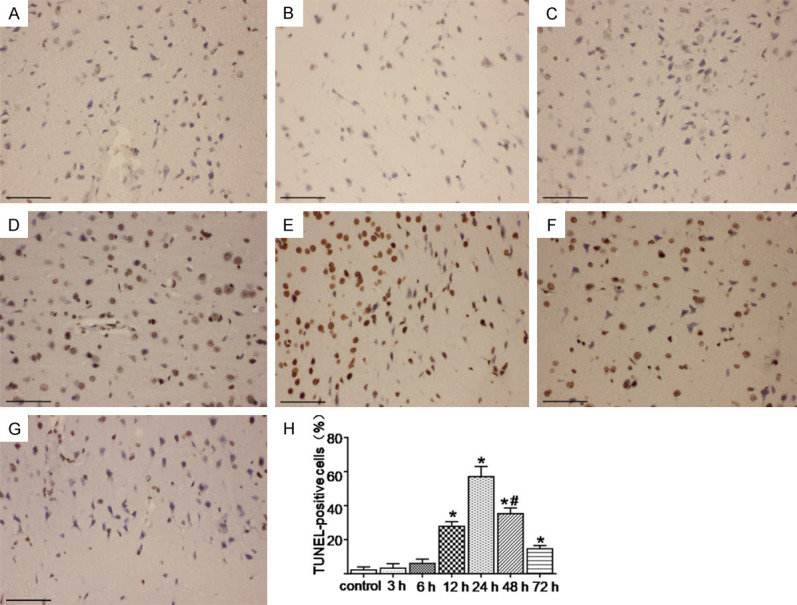
Figure 3.

TUNEL staining was used to determine the changes in neuronal apoptosis in the cerebral cortex at various time points after the SAH. (A-G) Represents the control and the 3 h, 6 h, 12 h, 24 h, 48 h, and 72 h groups after the SAH, respectively. (H) Represents the change of neuronal apoptosis rate in each group. The most severe neuronal apoptosis was observed at 24 h after the SAH, and then the level decreased. The number of apoptotic cells was still significantly different from the control group at 72 h after the SAH. *; P < 0.05 versus the control group, #; P < 0.05 versus the 24 h group after SAH. Bar = 100 μm.
