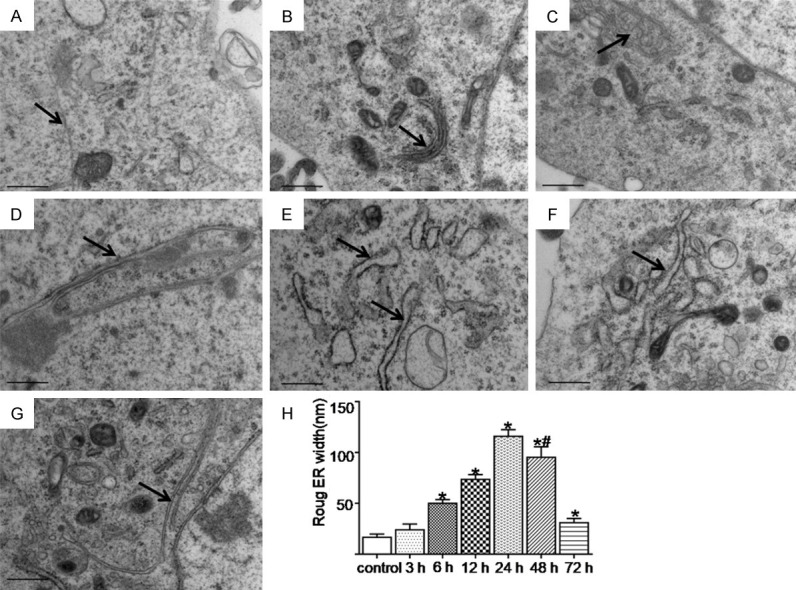
Figure 4.

The ultrastructural changes of the rough ER at the different time points were observed using TEM after SAH. The black arrow indicates the rough ER. (A-G) Represents the control and the 3 h, 6 h, 12 h, 24 h, 48 h, and 72 h groups after SAH, respectively. (H) Represents the width variation of rough ER in each group. The rough ER swelling was most serious at 24 h after the SAH. Compared with the control group, rough ER swelling was still observed at 72 h after the SAH. *; P < 0.05 versus the control group, #; P < 0.05 versus the 24 h group after SAH. Bar = 0.5 μm.
