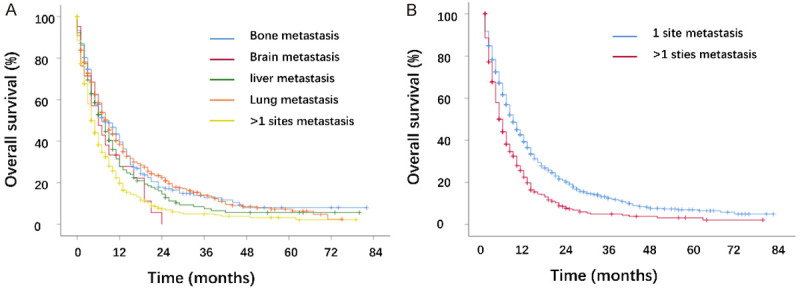
Figure 2.

Kaplan-Meier curves of the overall survival in cervical cancer. A. Stratified by different metastatic location (bone vs. brain: P=0.107; bone vs. liver: P=0.108; bone vs. lung: P=0.983; bone vs. >1 site: P<0.001; brain vs. liver: P=0.349; brain vs. lung: P=0.068; brain vs. >1 site: P=0.636; liver vs. lung: P=0.080; liver vs. >1 site: P=0.002; lung vs. >1 site: P<0.001). B. Stratified by different metastases number (P<0.001).
