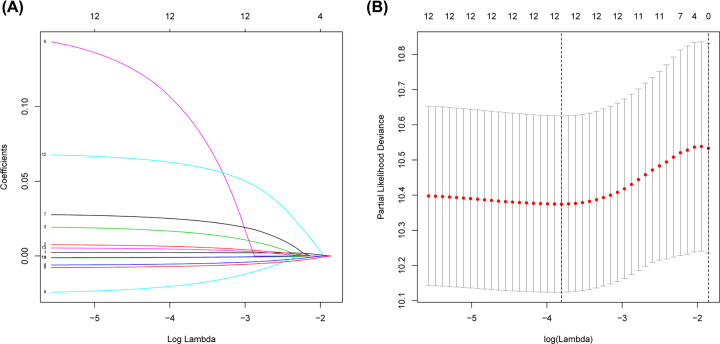
Figure 9. Identification of prognosis-related mRNAs using LASSO regression model.
(A) LASSO coefficient profiles of the mRNAs associated with the OS of OC. (B) Plots of the cross-validation error rates. Each dot represents a λ value along with error bars to give a confidence interval for the cross-validated error rate.

