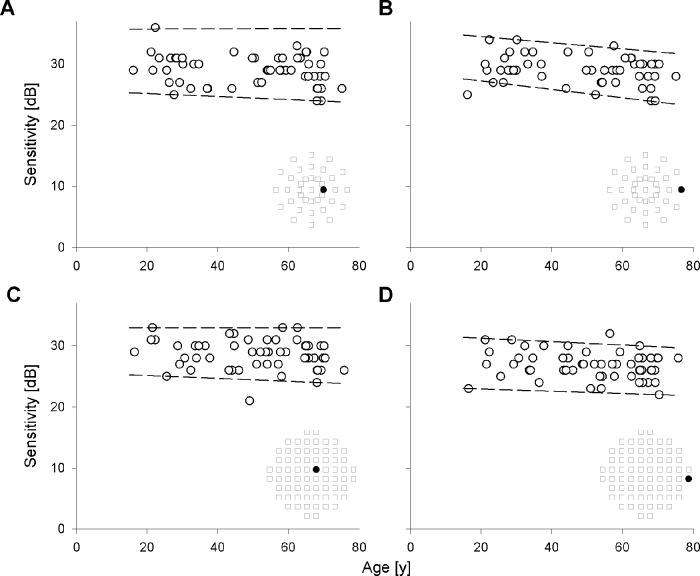
Figure 2.
Retinal sensitivity versus age in all healthy eyes are shown for locus number A2 at 1° (A) and locus number A26 at 3° of retinal eccentricity (B) in Grid A, as well as locus number B1 at 1.4° (C) and locus number B68 at 9.1° in Grid B. At each locus, regression of the 97.5th (upper dashed line) and 2.5th quantile (lower dashed line) is plotted. Inset shows location of the loci in test grids (filled square).

