Figure 2.

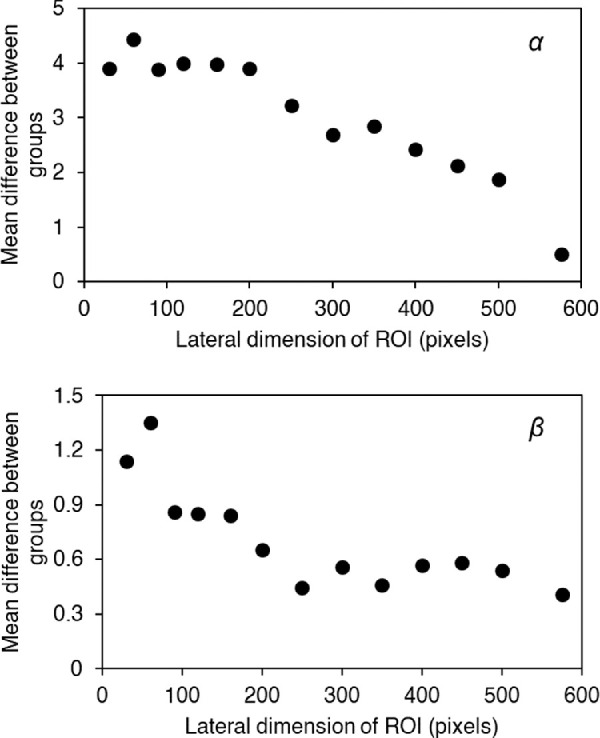
The mean differences between the groups (KC vs. control) for parameters α (top) and β (bottom) as a function of the lateral dimension of ROI (number of pixels).

The mean differences between the groups (KC vs. control) for parameters α (top) and β (bottom) as a function of the lateral dimension of ROI (number of pixels).