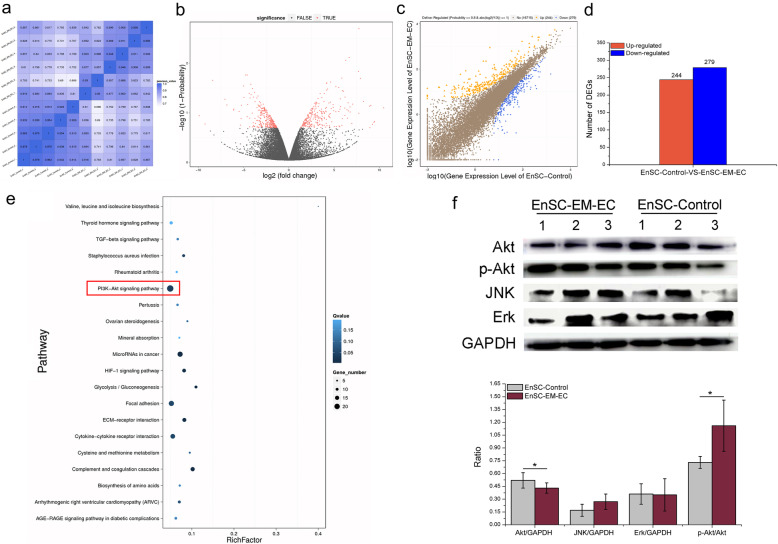
Fig. 6.
The DEGs between EnSC-Control and EnSC-EM-EC and the pathways enriched with these DEGs. a Heat map of correlation coefficients for the analysis of EnSC-Control and EnSC-EM-EC. The gradient colour barcode at the top right indicates the minimum value in white and the maximum in blue. If one sample is highly similar to another sample, the value of the correlation coefficients is very close to 1. b Volcano plot of all genes expressed between EnSC-Control and EnSC-EM-EC. The red dots indicate significant DEGs that passed the screening threshold, and the black dots indicate nonsignificant DEGs. c Scatter plots of all genes expressed in EnSC-Control and EnSC-EM-EC. The blue rhombi indicate downregulated genes, the orange triangles indicate upregulated genes and the brown dots indicate genes with unaltered expression. The screening threshold is shown above the legend. d Statistics of DEGs between EnSC-Control and EnSC-EM-EC. The blue bars denote downregulated genes, and the orange bars denote the upregulated genes. e Pathway enrichment statistics for DEGs between EnSC-Control and EnSC-EM-EC. The rich factor indicates the ratio of the number of differentially expressed gene annotated in a pathway term to the number of all genes annotated in that pathway term. A higher rich factor indicates higher enrichment. The Q value is the corrected p value (range 0–1) and a lower Q value indicates higher enrichment. Only the top 20 enriched pathway terms are shown. f Conventional WB was used to identify the key roles of PI3K/Akt signalling pathways. The grayscale value of the band representing each targeted protein was quantitated with ImageJ

