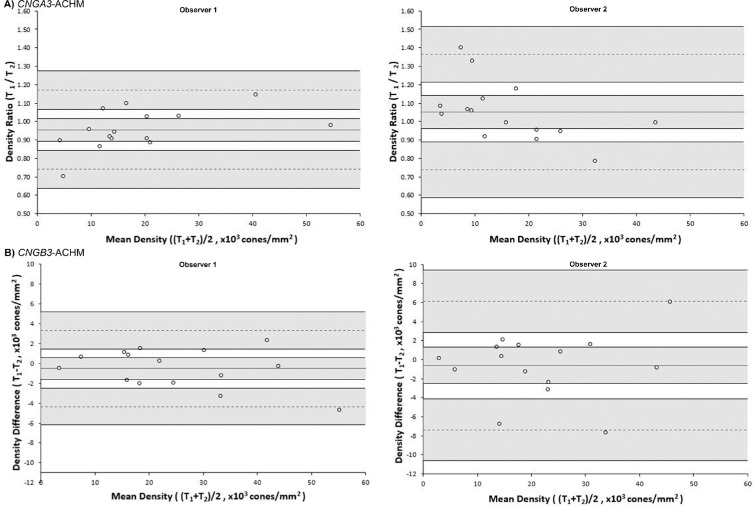
Figure 1.
Bland-Altman plots illustrating the intraobserver repeatability of foveal cone density for (A) CNGA3-ACHM and (B) CNGB3-ACHM for observers 1 and 2. The mean foveal cone density difference (bias) is represented by the central solid black line, while the dashed lines represent the limits of agreement for the bias. Shaded regions represent the confidence intervals for the bias and limits of agreement. The data for CNGA3-ACHM were not normally distributed, so the ratio was used instead of the difference. T, trial.

