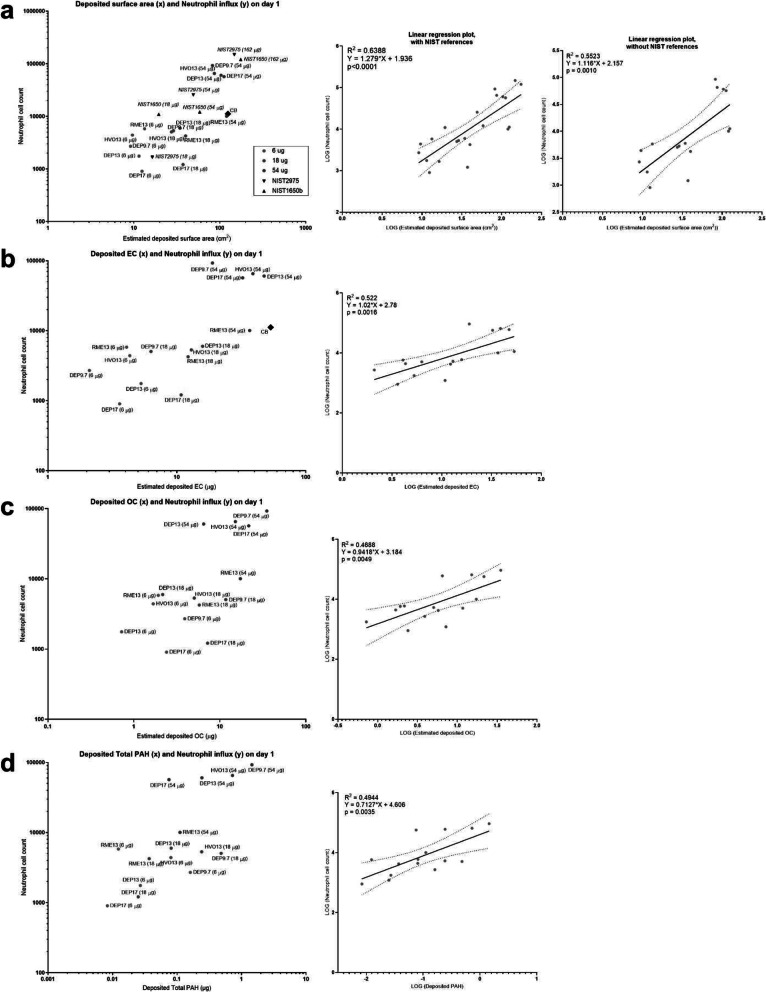
Fig. 8.
Deposited surface area, EC, OC, and PAH correlations with neutrophil influx on day 1. (a) Estimated deposited surface area, original data (left panel) and linear regression plots with and without NIST references (right panels). (b) Estimated deposited elemental carbon, original data (left panel) and linear regression plot (right panel). (c) Estimated deposited organic carbon, original data (left panel) and linear regression plot (right panel). (d) Estimated deposited Total (native) PAH, original data (left panel) and linear regression plot (right panel). The estimated deposited specific surface area (SSA), elemental carbon (EC), organic carbon (OC) and PAHs were calculated by multiplying the physicochemical values by the dose (EC and OC: dose in μg * EC fraction = deposited EC in μg; for SSA: dose in g * SSA m2/g = deposited SSA in g; for PAH: dose in g * PAH μg/g = deposited PAH in μg). The data was log-transformed for the linear regression analysis

