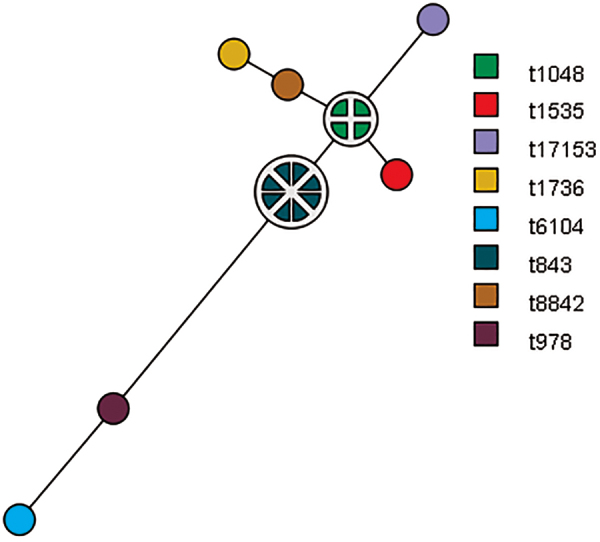
FIG. 1.

MST analysis of MRSA/mecC isolates (n = 18) illustrating the relationship within cluster. The nodes/one-colored circles consist of isolates with the same genotype, the size of node/circle correlates with the number of genetically identical isolates, and the distance between nodes represents the genetic relationship between nodes. MST, minimum spanning tree; MRSA, methicillin-/oxacillin-resistant Staphylococcus aureus. Color images are available online.
