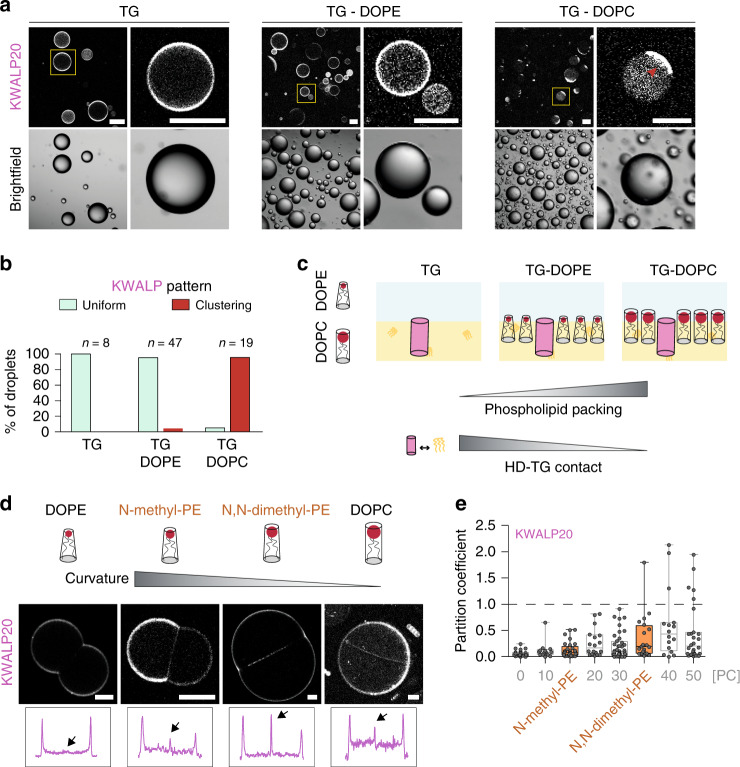
Fig. 4. The partitioning of KWALP is altered by phospholipid shape.
a KWALP20 surface distribution in bare TG-buffer droplets or in TG-buffer droplets covered by DOPE or DOPC. Red arrow highlights peptide clustering (in DOPC condition). The yellow square regions are enlarged on the right side of each image. Scale bar: 100 µm. b Quantification of KWALP pattern, i.e., uniform (light green) or clustering (red) signal, in TG (n = 8), TG + DOPE (n = 47) and TG + DOPC (n = 19), from n independent measurements. c Schematic representation of the difference in phospholipid packing, and thus in HD-TG contact, when DOPE (cone shape) or DOPC (cylinder shape) are present. Increasing DOPC concentration in a DOPC/DOPE monolayer increases the lipid packing and decreases the contact between HDs and TG. d Distribution of KWALP20 in DOPE, N-methyl-PE, N,N-dimethyl-PE, and DOPC DIBs. These phospholipids have incremental curvature between that of DOPE and DOPC. KWALP20 is labeled with Rh-B. Line profiles (not displayed) are drawn perpendicular to the bilayer and monolayers (as described in Fig. 2b); the thickness of the line is 30–40% of the bilayer size. Arrows indicate the bilayer signal. Scale bar: 20 µm. e Partition coefficient of KWALP20 in DIBs of different compositions is represented as box-plots (box limits, upper and lower quartiles; middle line, median; whiskers, minimum and maximum value). Sample size is n = 29 and 20 for KWALP20 in N-methyl-PE and N,N-dimethyl-PE respectively. Previous results of varying PC/PE ratios (Fig. 3e) are reported in light gray. Individual data points are indicated. Source data are provided as a Source Data file.

