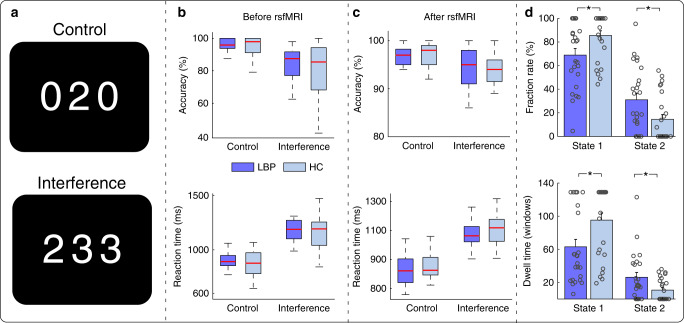
Fig. 6. MSIT behavior performance and dFNC occurrences.
a MSIT trial examples. b Accuracy and reaction time for control and interference tasks before resting-state fMRI (rsfMRI) in cLBP and HCs. c Accuracy and reaction time for control and interference tasks after rsfMRI in cLBP and HCs. d Group differences of occurrences in cLBP and HCs. N = 25 and 25 for cLBP patients and HCs, respectively. The boxes in b and c represent the 25th and 75th percentiles, and the red line represents the median of scores for accuracy or reaction time. The bars and errorbars in d represent the mean and SEM. Each circle represents the data for an individual. Asterisks represent significant differences at two-sided pFDR < 0.05 for t-test. Source data are provided as a Source Data file.

