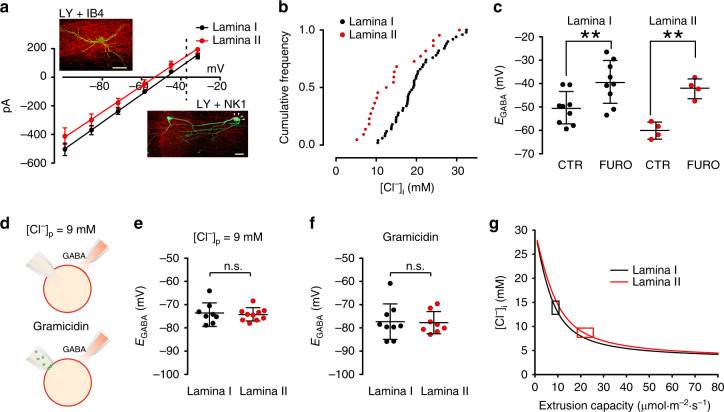
Fig. 2. Heterogeneous Cl−-extrusion capacity across lamina I and II.
a Mean GABA I-V curves from LI (EGABA = –45.9 ± 6.2 mV, n = 50; black) and LII (EGABA = (–53.2 ± 9.5 mV, n = 22; red) neurons. Dashed line indicates the expected EGABA value according to the GHK equation. Insets show Lucifer-yellow-injected neurons in LI (top) and LII (bottom). Proper laminar localization is confirmed by NK1 and IB4 immunostaining (in red). Arrowheads show a NK1-positive recorded neuron. Scale bar = 20 µm. b Distribution of estimated [Cl−]i for LI (n = 50; black) and LII (n = 22; red). cEGABA measured in LI and LII in control (–50.6 ± 6.9 mV, n = 9, black and –60.2 ± 3.5 mV, n = 4, red, respectively) and after furosemide administration (–39.5 ± 9.2 mV, and –42.1 ± 4.2 mV, respectively). d Schematic representation of EGABA recording in whole-cell configuration with a low Cl− pipette solution (9 mM; upper panel) and in gramicidin-perforated patch conditions (Cl−-impermeant channels in green; lower panel). eEGABA measurements between LI and LII neurons with a low Cl− load (–73.6 ± 4.7 mV, n = 8 and –74.3 ± 2.7 mV, n = 10, respectively). fEGABA measured in LI and LII in the presence of physiological [Cl−]i in gramicidin-perforated patch clamp (–77.3 ± 7.6 mV, n = 9 and –77.8 ± 4.8 mV, n = 8, respectively). g Relative change of [Cl−]i as a function of KCC2 extrusion capacity in LI and LII. Cl− diffusion simulations were taken from the neuronal model in Fig. 1d, considering LI and LII neuronal geometries and somatic [Cl−]i. Boxes represent the range of extrusion capacities consistent with electrophysiology measurements. CTR control, FURO furosemide; n.s. not significant. Data are shown as mean ± S.D. *P < 0.05, **P < 0.01.

