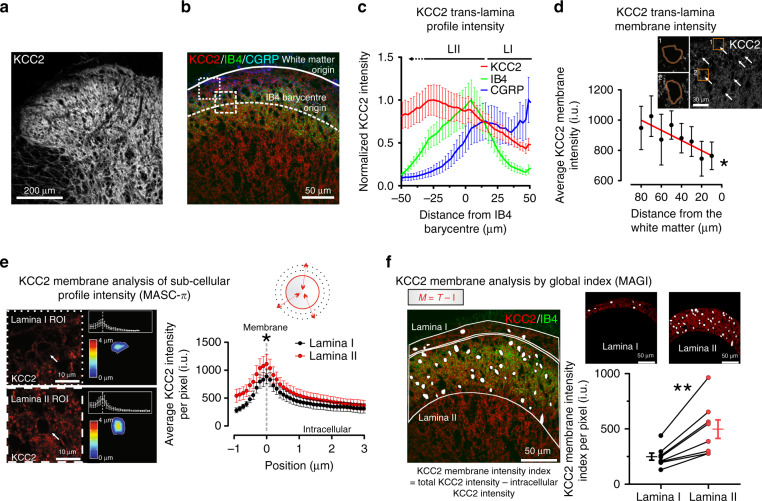
Fig. 4. Interlaminar gradient of KCC2 in the superficial dorsal horn.
a Confocal image of KCC2 staining in the rat SDH. b CGRP (blue), IB4 (green), and KCC2 (red) staining in the rat SDH (dorsal white matter border, solid line; barycentric origin of IB4, dashed line). Boxed areas represent regions of interest (ROIs) surrounding LI (small dash) and LII neurons (big dash). c CGRP/IB4/KCC2 mean fluorescence intensities in the SDH as a function of the position towards the IB4 barycentric origin (n = 8 rats). d Membrane KCC2 intensity (arrows) as a function of distance from the dorsal white matter (n = 6). Insets, ROIs of neurons located superficially (1) and deeper (2) in the SDH (boxed areas). The slope of KCC2 intensity across SDH is significantly different from 0 (F = 15.5, P = 0.008); one-way-RM-ANOVA, n = 6, F = 18.5, P < 0.001. e Membrane analysis of sub-cellular profile intensities (MASC-π). On the left, KCC2-expressing neurons (arrows) in LI and LII from ROIs in b. The color-coded distance map illustrate the shift in KCC2 intensity with the distance to the membrane profile. The graphs in the insets quantify the KCC2 intensity as a function of distance to the membrane profile. On the right, pooled KCC2 values per rat as a function of distance to the membrane profile for all LI (n = 8) and LII (n = 8). The pictogram on the top right is a schematic representation of the method (f). Membrane analysis by global index (MAGI). On the left, ROIs containing LI and LII, delineated based on IB4 staining (in green). The global intensity index of the membrane KCC2 intensity per pixel (M, red) in each lamina is measured by automated subtraction of intracellular intensity (I, white) from the total intensity (T). Top right, demonstrative LI and II ROIs. Bottom right, quantification of membrane KCC2 signal in LI and LII by global intensity index. i.u. intensity units, CGRP calcitonin gene-related peptide, IB4 isolectin B4. Data are shown as mean ± S.E.M. *P < 0.05, **P < 0.01.

