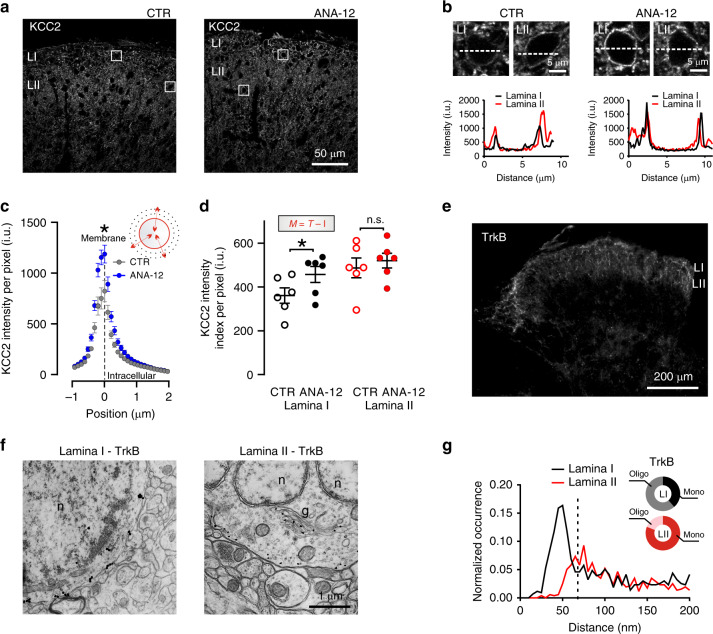
Fig. 5. TrkB signaling impacts the interlaminar KCC2 gradient.
a Representative confocal images of KCC2 expression in SDH in control and ANA-12 treated rats. b Enlargements from the boxes in a show membrane KCC2 intensity in representative laminae I and II cells and correlative profile plots of pixel intensities across the cell bodies in a 10 µm segment (dashed lines). c KCC2 membrane profile intensity per pixel (see Fig. 4e) measured in LI (0–20 µm from the white matter) of vehicle- (n = 6) and ANA-12-treated rats (n = 6). d Global intensity index (M = T – I) in LI (0–20 µm) and LII (20–80 μm from the white matter) in control and ANA-12 treated rats. e Strong staining of full-length TrkB immunofluorescence in the rat dorsal horn obtained with FluoroNanogoldTM probe. f Ultrastructural labeling showing the somatic localization of full-length TrkB receptor in LI–II neurons. Labeling is mostly localized at the membrane level, although gold-intensified particles can also be found in the Golgi apparatus and in the rough endoplasmatic reticulum. g Frequency distribution of the interparticle distances in LI (black) and LII (red). Note the different position and size of the distribution peaks indicating a higher degree of particle proximity in LI. Dashed line indicates the cutoff interparticle distance to discriminate between monomers and oligomers (65 nm). Pie graphs in the inset illustrate the proportion of paired gold particles whose distance is shorter (gray/pink: putative oligomers) or larger (black/red: putative monomers) than 65 nm in LI (61%, n = 506 particles and 39%, n = 320 particles, respectively) and in LII (19%, n = 133 particles and 81%, n = 568 particles, respectively). CTR control, ANA-12 N-[2-[[(Hexahydro-2-oxo-1H-azepin-3-yl)amino]carbonyl]phenyl]benzo[b]thiophene-2-carboxamide, i.u. intensity units, n.s. not significant. Data are shown as mean ± S.E.M. *P < 0.05, **P < 0.01.

